


Pardon the pun in the title. Halitosis is the medical term for bad breath that doesn’t go away. It seemed like an appropriate way to describe the bad breadth that has accompanied the S&P 500 (SPX) Index this month. Although SPX was up 0.86% for the month through yesterday, index decliners outpaced advancers every day.
Here’s the evidence:
SPX Cumulative Advances-Declines with Index Levels and Daily Changes
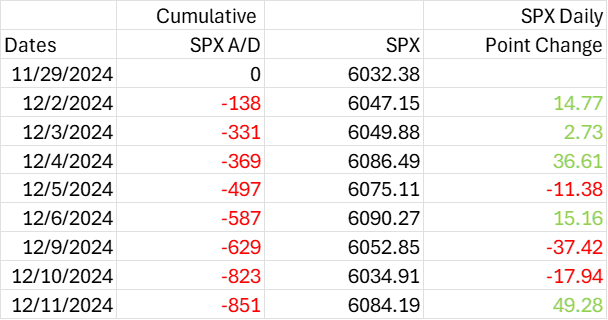
Source: Interactive Brokers
As noted above, there SPX advances – declines are 8 for 8 to the downside. Over that same time period, SPX rose 5 of those 8 days. We’ve all been taught that broader rallies are better, and obviously – at least within the confines of SPX – this is anything but.
I really wish I could assert that this is a meaningful signal, but it might simply be a statistical oddity. Eight days is hardly a significant sample size, and it’s not as though SPX ripped higher during the short time period in question. Certain stocks did – I’m looking at you, Tesla (TSLA) – and within the confines of a top-heavy capitalization weighted index that can be sufficient. It was certainly the case yesterday, when we saw aggressive “buy the dip” activity in megacap tech names after two days of selling. An in-line CPI report was apparently good enough to spur a bit of a relief rally.
Yet there is one other signal that seems to require some consideration among the overall enthusiasm. We’ve occasionally noted when the Cboe Volatility Index (VIX) fails to follow the Cboe 1-Month Correlation Index (COR1M) lower. In general, high correlations within an index leads to higher volatility and vice versa. Recently we have seen COR1M sink, but VIX seems to have found a level, albeit a low one. This is something that we’ve seen before:
6-Months, COR1M (white), VIX (red)
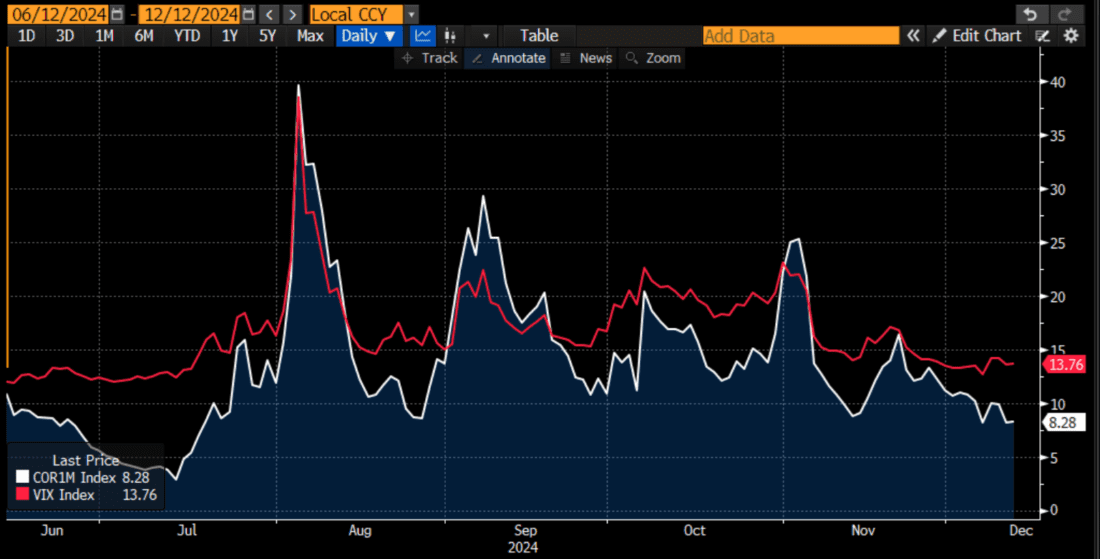
Source: Bloomberg
Note how VIX moved sideways in June-July, late August, October, and November even as COR1M moved lower. Each case was followed by a jump in VIX. And the longer the divergence, the bigger the VIX jump; the August jump was the implosion of the yen carry trade, while the other spikes in VIX were the result of relatively modest selling. We see the same thing occurring now, but it is far too early to say that we have reached an extreme or a worrisome divergence. But when we combine that with our findings from earlier this week, when we noted that below market SPX options were simultaneously rich AND cheap, implying that there is indeed demand for some market insurance.
The party can continue, and Santa can arrive, whether with a sleigh or via interest rate cuts. But savvy traders should at least pay attention to some of the warning signs about the overall health of the market. So far it is the sniffles or just a case of bad breath. But there are some symptoms that can lead to something more meaningful if left unattended.
New to Interactive Brokers?
Open AccountAlready an Interactive Brokers Client?
Request Trading PermissionDisclosure: Interactive Brokers
The analysis in this material is provided for information only and is not and should not be construed as an offer to sell or the solicitation of an offer to buy any security. To the extent that this material discusses general market activity, industry or sector trends or other broad-based economic or political conditions, it should not be construed as research or investment advice. To the extent that it includes references to specific securities, commodities, currencies, or other instruments, those references do not constitute a recommendation by IBKR to buy, sell or hold such investments. This material does not and is not intended to take into account the particular financial conditions, investment objectives or requirements of individual customers. Before acting on this material, you should consider whether it is suitable for your particular circumstances and, as necessary, seek professional advice.
The views and opinions expressed herein are those of the author and do not necessarily reflect the views of Interactive Brokers, its affiliates, or its employees.


Join The Conversation
If you have a general question, it may already be covered in our FAQs page. go to: IBKR Ireland FAQs or IBKR U.K. FAQs. If you have an account-specific question or concern, please reach out to Client Services: IBKR Ireland or IBKR U.K..
Visit IBKR U.K. Open an IBKR U.K. Account