


The article “When Everyone Trades the Same Factor Playbook” was originally posted on Alpha Architect.
For decades, academic researchers have catalogued hundreds of patterns in the stock market — statistical regularities linking firm characteristics to future returns. These persistent return patterns, unexplained by standard risk models, are known as anomalies. They now form the intellectual backbone of a multi-trillion-dollar industry called factor investing, implemented through mutual funds, hedge funds, and ETFs worldwide.
The premise is straightforward: buy stocks with characteristics associated with high returns (the right, or “long leg”) and short stocks with characteristics associated with low returns (the left, or “short leg”).
Anders Posselt and Mads Kjær, authors of the March 2026 study, “Anomaly-Driven Demand,” examined what happens to market prices when millions of investors simultaneously follow the same mechanical rules to rebalance the same portfolios? If you allocate to factor strategies, this paper has interesting findings as to where your returns are actually coming from.
Research Design
Anomaly strategies are constructed by sorting stocks on a trait, or characteristic — say, book-to-market for value investing. Because those characteristics change over time, portfolio constituents are not static. Stocks drift in and out of the long and short legs every month as their characteristics update.
Each time a stock enters the long leg of a value strategy, value investors must buy it. When it exits, they must sell. This is mechanical, predictable rebalancing — analogous to what happens when a stock is added to or removed from an index like the S&P 500.
Now extend that logic across to what researchers have dubbed a “zoo’ of anomalies” — hundreds of different published anomalies simultaneously. A stock that enters the long leg of many anomalies at once is being targeted by a large, diverse population of factor investors all rebalancing in the same direction, at approximately the same time. The authors call this cumulative buying (or selling) pressure Anomaly-Driven Demand (ADD).
With ADD defined, the authors then tested whether it actually predicts returns.
Constructing the ADD Measure
For each of the 209 anomalies in the Chen and Zimmermann dataset, the authors sorted stocks into portfolios (quintiles) based on the anomaly characteristic. Each month, they counted — for each individual stock — how many anomaly long legs it had newly entered minus how many short legs it had newly entered. The change in this net count from one month to the next is ADD.
A high ADD value means a stock has recently become a constituent in many more long legs than short legs, signaling that a large wave of anomaly rebalancing will be directed toward buying that stock. A low ADD value signals the opposite — coordinated selling pressure.
Crucially, ADD is constructed entirely from publicly observable firm characteristics. No access to investor position data, no proprietary holdings, no insider information. Just the mechanical logic of how anomaly portfolios are built.
Key Findings
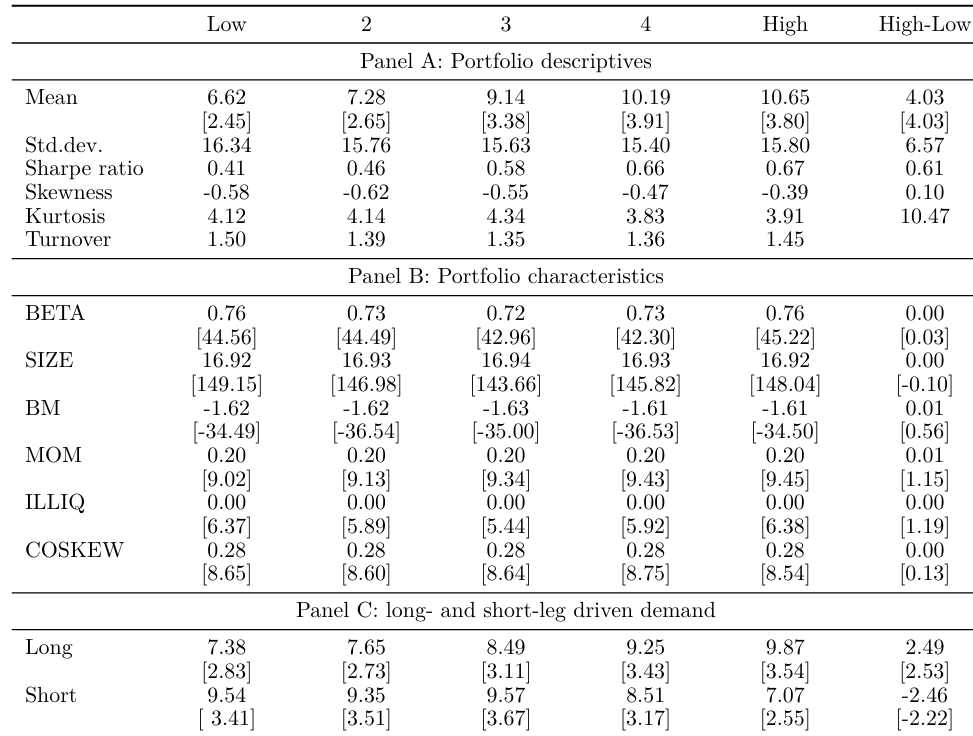
High-ADD stocks significantly outperform low-ADD stocks
Sorting stocks into five groups by ADD, annualized excess returns rose monotonically from 6.62% in the lowest group to 10.65% in the highest — a spread of 4.03 percentage points, with a t-statistic of 4.03. The Sharpe ratio of a long-short strategy based purely on ADD was a robust 0.61.

The results are hypothetical results and are NOT an indicator of future results and do NOT represent returns that any investor actually attained. Indexes are unmanaged and do not reflect management or trading fees, and one cannot invest directly in an index.
The effect cannot be explained by standard risk factors or anomaly exposure
After controlling for the Fama-French five-factor model, momentum, the first three principal components of anomaly returns, and a custom portfolio designed to isolate anomaly exposure, the alpha of the high-minus-low ADD spread remained statistically and economically significant across all specifications.
ADD predicts real changes in investor positioning
Short interest rose for low-ADD stocks and fell for high-ADD stocks in the subsequent month. The fraction of institutional investors holding a stock — its “breadth” — increased significantly with ADD, and this pattern was driven specifically by stocks entering more anomaly long legs. The demand measure is tracking something real.
Returns are concentrated in the first trading days of the month
The entire High-Low return differential was generated in the first six trading days of the month — the window when institutional investors rebalance after month-end characteristic updates. Decomposing further, it was driven entirely by open-to-close (intraday) returns, not overnight returns. This is the signature of institutional order flow, not retail speculation.
The price impact is permanent, not a temporary liquidity blip
Tracking the same set of stocks over 12 months after portfolio formation, there was no reversal of the initial return differential. The cumulative spread remained stable or drifted slightly higher. This is consistent with demand-based pricing theory, where a shift in the demand curve for a stock leads to a permanent change in its equilibrium price.
Anomalies with larger long-short ADD imbalances earn substantially higher returns
Shifting focus from individual stocks to anomaly portfolios, the authors found that anomalies whose long legs contain high-ADD stocks and whose short legs contain low-ADD stocks earned 8.04 percentage points more per year than anomalies at the other extreme. A one-standard-deviation increase in ADD imbalance predicted 24 basis points higher next-month returns.
Which anomaly categories matter most?
Breaking ADD down by economic category, the data showed that valuation-related signals played an outsized role, consistent with value investing’s long history — dating to Graham and Dodd (1934) — and its enormous institutional following. The “Other” category, which aggregates many independent, weakly-correlated strategies like seasonality and betting-against-beta, also contributes significantly, reinforcing the idea that the effect is driven by the aggregate of many overlapping strategies, not any single signal.
The effect is stronger for high-quality anomalies
Consistent with the finding that anomalies with higher published t-statistics attract more investor attention and trading, the price impact of ADD is concentrated among statistically robust anomalies. For low-t anomalies, the High-Low spread is essentially zero. For high-t anomalies, the spread jumps to over 5 percentage points, and the effect is asymmetric — changes in long-leg inclusions have a larger price impact than short-leg changes, likely because many institutional investors (such as mutual funds) face constraints on short selling.
The effect persists even in large, liquid stocks
Sorting on market capitalization and liquidity, the authors found a U-shaped pattern: the ADD effect was strongest for micro-cap and mega-cap stocks alike, and weakest in the middle. The micro-cap result is intuitive — small, thinly traded stocks are more sensitive to any buying or selling pressure, so coordinated rebalancing moves prices more. The mega-cap result, a statistically significant 3 percentage points annualized premium, is more surprising. It likely reflects the sheer scale of assets chasing the same large, liquid names. The most popular factor strategies are overwhelmingly concentrated in large, well-known stocks — the same ones that dominate every major index and screener. When trillions of dollars rebalance in the same direction in those names on the same schedule, even deep liquidity is not enough to fully absorb the flow without a price impact.
Interpreting the Results
The conventional debate about why anomalies generate returns has three camps: they reflect compensation for risk, they reflect investor mispricing, or they are statistical artifacts that do not survive scrutiny. This paper introduces a fourth channel that operates on top of whichever of those is correct.
As factor investing has grown, its rebalancing activity has become large enough to generate meaningful demand pressure in the stocks that define anomalies’ long legs — and selling pressure in those that define the short legs. This mechanically inflates observed returns, which attracts more capital into the same strategies, which drives larger rebalancing flows, which produces more price pressure, which inflates returns further. The anomaly, in other words, is partly feeding itself. Perhaps the most striking implication of these findings is not any single result but the feedback loop they collectively describe.
This is structurally similar to what happens with the index inclusion effect — a well-documented source of predictable price pressure from mechanical, inelastic demand. The difference is scale: the factor investing ecosystem now manages trillions of dollars, and its rebalancing activity is synchronized across hundreds of strategies simultaneously.
Their findings led Kjær and Posselt to conclude: “trading on anomalies generates price pressure in the underlying stocks.” They added: “As investors rebalance to maintain exposure, their trading affects the very returns they seek to earn.”
Taken together, these findings tell a coherent story. Factor investing has grown large enough that its own rebalancing activity has become a meaningful driver of the returns it seeks to capture. The demand pressure is real, it is measurable from public data alone, and it shows up exactly where you would expect it — at the start of each month, in the most crowded and widely-followed strategies, and in the stocks that sit at the intersection of many anomaly portfolios simultaneously. What began as an academic observation about stock characteristics has, through the sheer weight of capital that followed, become a force reshaping the very patterns it set out to track.
Key Investor Takeaways
- Anomaly returns are partly mechanical. A portion of the returns earned by factor strategies is generated by the collective rebalancing of other factor investors, not purely by the underlying economic logic of the signals. This has implications for how practitioners should think about true return expectations — especially as factor investing grows.
- Timing and coordination matter. The effect is concentrated at the start of each month, when institutional investors rebalance en masse. Market participants who understand this calendar pattern — and the stock-level demand signals it generates — may be able to anticipate short-term price movements.
- The most popular anomalies carry the most embedded demand pressure. Statistically strong, widely-followed anomalies drive the effect far more than obscure ones. Investors who concentrate in high-t-statistic factors are both the source and beneficiary of this price pressure — a feedback loop worth watching as assets under management continue to grow.
- Price pressure does not reverse. Unlike temporary liquidity squeezes, the demand-induced price changes documented here are permanent — consistent with a genuine shift in equilibrium pricing. This suggests that the crowding of factor investing is a structural, not transient, feature of modern markets.
- Factor investing is now large enough to move its own markets. The paper offers a sobering reminder that in a world where trillions track the same signals, the act of measurement changes the phenomenon being measured. Anomalies that were discovered as passive predictors of returns have become active agents in generating those returns.
Larry Swedroe is the author or co-author of 18 books on investing, including his latest Enrich Your Future. He is a consultant to RIAs as an educator on investment strategies. This article is for informational and educational purposes only and should not be construed as specific investment, accounting, legal, or tax advice.
Disclosure: Alpha Architect
The views and opinions expressed herein are those of the author and do not necessarily reflect the views of Alpha Architect, its affiliates or its employees. Our full disclosures are available here. Definitions of common statistics used in our analysis are available here (towards the bottom).
This site provides NO information on our value ETFs or our momentum ETFs. Please refer to this site.
Disclosure: Interactive Brokers Third Party
Information posted on IBKR Campus that is provided by third-parties does NOT constitute a recommendation that you should contract for the services of that third party. Third-party participants who contribute to IBKR Campus are independent of Interactive Brokers and Interactive Brokers does not make any representations or warranties concerning the services offered, their past or future performance, or the accuracy of the information provided by the third party. Past performance is no guarantee of future results.
This material is from Alpha Architect and is being posted with its permission. The views expressed in this material are solely those of the author and/or Alpha Architect and Interactive Brokers is not endorsing or recommending any investment or trading discussed in the material. This material is not and should not be construed as an offer to buy or sell any security. It should not be construed as research or investment advice or a recommendation to buy, sell or hold any security or commodity. This material does not and is not intended to take into account the particular financial conditions, investment objectives or requirements of individual customers. Before acting on this material, you should consider whether it is suitable for your particular circumstances and, as necessary, seek professional advice.
Disclosure: Short Selling
Short selling is an advanced trading strategy involving potentially unlimited risks and must be done in a margin account.
Disclosure: Margin Trading
Trading on margin is only for sophisticated investors with high risk tolerance. You may lose more than your initial investment. Before trading, read the Disclosure of Risks of Margin Trading, available in the Forms and Disclosures section of your local Interactive Brokers website. For additional information regarding margin loan rates, see the Pricing section of your local Interactive Brokers website.
Disclosure: Mutual Funds
Not all funds are available to retail investors. Mutual Funds are investments that pool the funds of investors to purchase a range of securities to meet specified objectives, such as growth, income or both. Investors are reminded to consider the various objectives, fees, and other risks associated with investing in Mutual Funds. Please read the prospectus accordingly. This communication is not to be construed as a recommendation, solicitation or promotion of any specific fund, or family of funds. Interactive Brokers may receive compensation from fund companies in connection with purchases and holdings of mutual fund shares. Such compensation is paid out of the funds' assets. However, IBKR does not solicit you to invest in specific funds and does not recommend specific funds or any other products to you. For additional information please visit the Mutual Funds section of your local Interactive Brokers website.
Join The Conversation
If you have a general question, it may already be covered in our FAQs page. go to: IBKR Ireland FAQs or IBKR U.K. FAQs. If you have an account-specific question or concern, please reach out to Client Services: IBKR Ireland or IBKR U.K..
Visit IBKR U.K. Open an IBKR U.K. Account