


Friday’s bounce was quite astounding. After a roughly 3% trading range last week, the S&P 500 (SPX) closed only a mere 7 points lower. The Nasdaq 100 (NDX), which had a 5.4% range, did close about 1.8% lower on the week, but the headlines were stolen by the brontosaurus of market measures when the Dow Jones Industrial Average (INDU) registered its first close above 50,000. To the best of my knowledge, despite the major milestone, no one had bothered to pass around “Dow 50K” hats…
Longtime readers should be familiar with my general disdain for the media’s continual focus on INDU as a meaningful market statistic. Frankly, it is archaic. There were no established ways to measure the broad market’s performance in 1884 when Charles Dow created an average comprising mostly railroad stocks – that era’s technological revolution. In 1886 he refined it to become the 12-stock Dow Jones Transportation Average, and ten years later, created the 12-stock Dow Jones Industrial Average. In 1916, the average was expanded to 20 companies, and another 10 stocks were added in October 1928 (just a year before the Crash).
“Average” is the key word to focus upon in the prior paragraph. It was clearly a logical way to construct a market statistic when none had previously existed, and a convenient way to maintain one when calculations were done with a pencil and paper. Unfortunately, this creates an undesirable outcome: an arithmetic average gives the highest weight to components with the highest price. The highest priced shares may or may not properly represent the actual importance of the components. As INDU is currently comprised, Goldman Sachs (GS), with a $940 stock price, has more than twice the weight of Microsoft (MSFT) with its $412 price. This is despite MSFT having more than 10X GS’ market capitalization. Sherwin-Williams’ (SHW) $359 stock price gives it only a more modest weight in INDU than MSFT, which is 35X larger. Price-weighted market measures are essentially randomly-weighted.
In 1926, Poor’s Publishing created a 233-stock index that utilized market capitalizations and was calculated weekly. By 1957, Poor’s had merged with the Standard Statistics Company, and the Standard & Poor’s Index was expanded to its now-familiar 500 shares. A market capitalization-weighted index offers much more relevance. By definition, there is much more invested in a stock with a high market cap; it thus deserves more weight in market measures.
Investors agree. Immensely more investment dollars are indexed to SPX than INDU. The largest ETF tracking SPX has a market capitalization of about $873 billion, and there are at least two more with market caps over $700 billion. In contrast, the flagship ETF that tracks INDU has a mere $45 billion. That imbalance is echoed, if not dwarfed, by the amount of money indexed via pension funds and other passive investments. Money talks, loudly.
There is indeed a benefit to following INDU in the current market environment, though. We are seeing a rotation from growth stocks into value stocks, led by money coming out of technology stocks – notably software companies in recent days. Hence, we saw the aforementioned underperformance of NDX versus SPX last week. INDU, on the other hand, has blundered into a much lower weighting of technology than SPX, let alone NDX. That is clearly a benefit to the many who check the level of INDU and the few who index to it.
A convenient way to measure the relative performance of the growth and value sectors is via SGX and SVX, the S&P 500 Growth and Value Indices, respectively. On a 5-year basis, SGX has greatly outperformed SVX, but on a 1-year basis, their performances are quite similar thanks to a recent, rotation-driven convergence. The new milestone in INDU is a testament to steady progress and a relative revaluation of key market sectors. Unfortunately, the information content of that average is minimal. It’s a living fossil.
5-Years Normalized, SVX (white/blue daily candles), SGX (blue line)
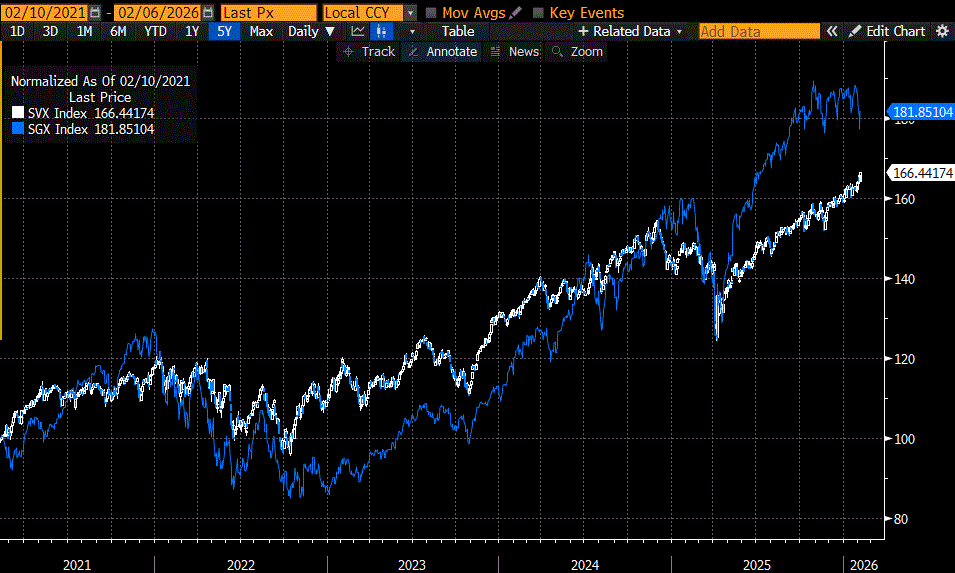
Source: Bloomberg, past performance is not indicative of future returns.
1-Year Normalized, SVX (white/blue daily candles), SGX (blue line)
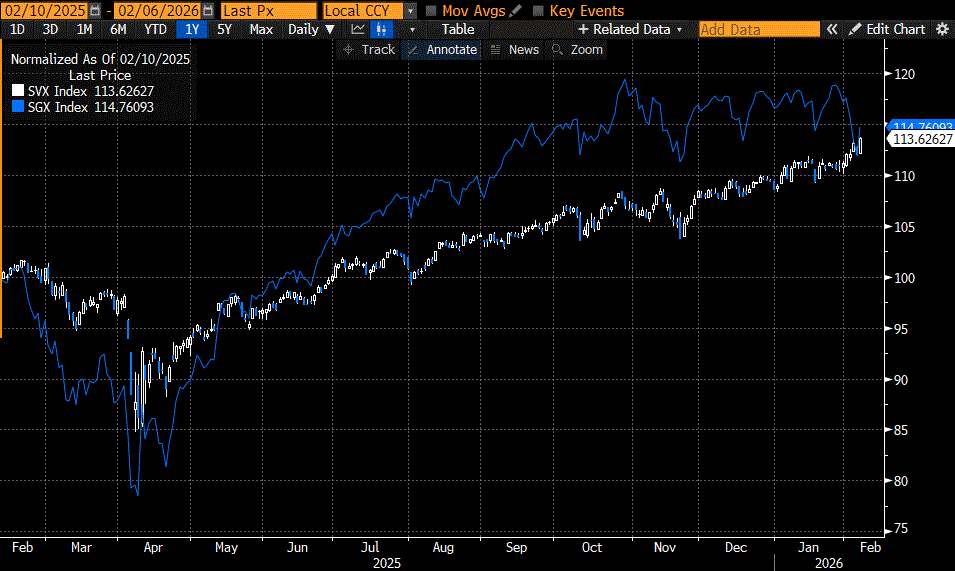
Source: Bloomberg, past performance is not indicative of future returns.
1-Year Normalized, INDU (white/blue daily candles), SPX (blue line), NDX (red line)
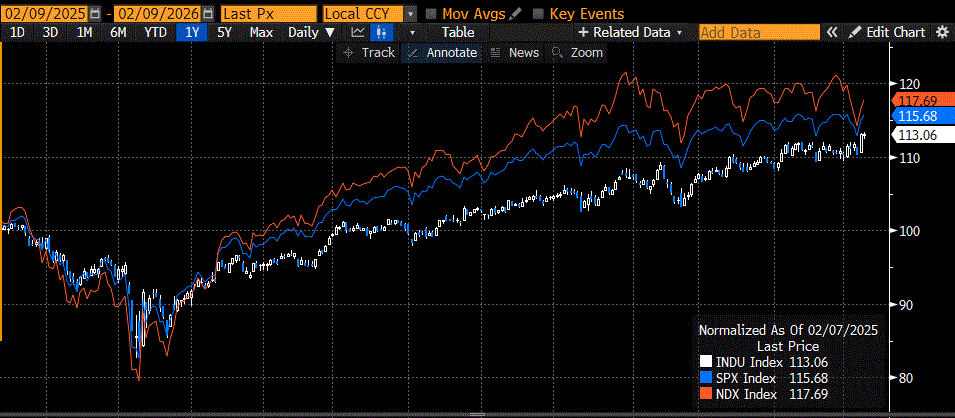
Source: Bloomberg, past performance is not indicative of future returns.
New to Interactive Brokers?
Open AccountAlready an Interactive Brokers Client?
Request Trading PermissionDisclosure: Interactive Brokers
The analysis in this material is provided for information only and is not and should not be construed as an offer to sell or the solicitation of an offer to buy any security. To the extent that this material discusses general market activity, industry or sector trends or other broad-based economic or political conditions, it should not be construed as research or investment advice. To the extent that it includes references to specific securities, commodities, currencies, or other instruments, those references do not constitute a recommendation by IBKR to buy, sell or hold such investments. This material does not and is not intended to take into account the particular financial conditions, investment objectives or requirements of individual customers. Before acting on this material, you should consider whether it is suitable for your particular circumstances and, as necessary, seek professional advice.
The views and opinions expressed herein are those of the author and do not necessarily reflect the views of Interactive Brokers, its affiliates, or its employees.
Disclosure: ETFs
Any discussion or mention of an ETF is not to be construed as recommendation, promotion or solicitation. All investors should review and consider associated investment risks, charges and expenses of the investment company or fund prior to investing. Before acting on this material, you should consider whether it is suitable for your particular circumstances and, as necessary, seek professional advice.


Join The Conversation
If you have a general question, it may already be covered in our FAQs page. go to: IBKR Ireland FAQs or IBKR U.K. FAQs. If you have an account-specific question or concern, please reach out to Client Services: IBKR Ireland or IBKR U.K..
Visit IBKR U.K. Open an IBKR U.K. Account