


Related reading: A few weeks ago, I outlined why the S&P 500 looked close to a bottom.
Just a few weeks ago, fear dominated markets. Geopolitical tensions between the US and Iran triggered a sharp selloff, sentiment collapsed, and many investors expected deeper downside.
Instead, the S&P 500 rebounded strongly and pushed back to all-time highs.
At the time, my view was that the decline looked more like an opportunity than the start of a structural bear market. That conclusion was not based on emotion or headlines, but on a combination of valuation, positioning, macro data, and historical market behavior.
Now that the index has recovered, the key question becomes:
What comes next?
In my opinion, the answer is more nuanced than simply “bullish” or “bearish.” Markets may still have room to move higher—but economic data is beginning to show signs of stress.
US GDP Growth Is Slowing
Recent quarters were strong, but the latest GDP trend suggests growth momentum is fading.
That does not automatically mean recession—but slowing growth combined with elevated valuations can create a more fragile backdrop.
Historically, periods of decelerating growth have often coincided with increased market volatility.
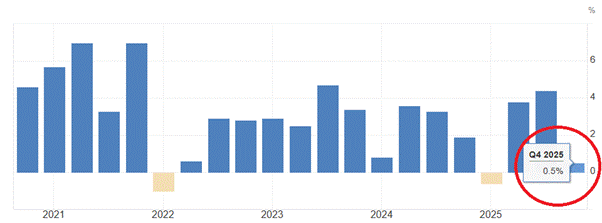
Source: https://tradingeconomics.com/, past performance is not indicative of future returns.
Inflation Is Reaccelerating
The latest inflation reading moved higher again, reaching levels above the Federal Reserve’s ideal target.
That matters because sticky inflation creates pressure in two areas:
- Consumers lose purchasing power
- Companies face margin pressure from rising input costs
Commodity-related disruptions and geopolitical uncertainty may be contributing factors.
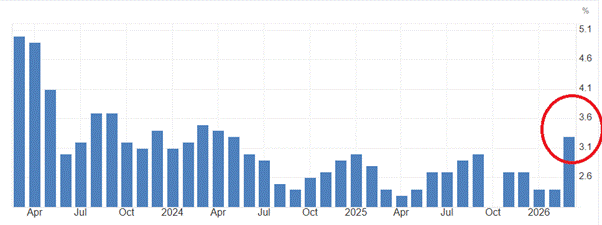
Source: https://tradingeconomics.com/, past performance is not indicative of future returns.
Interest Rates: A Classic Late-Cycle Signal?
One historical pattern investors often watch is this:
After the Fed raises rates aggressively, recessions have frequently emerged after rate cuts begin.
That does not mean rate cuts cause recessions. Rather, cuts often arrive because growth is weakening.
If economic softness continues, monetary easing may not be the bullish signal many assume.
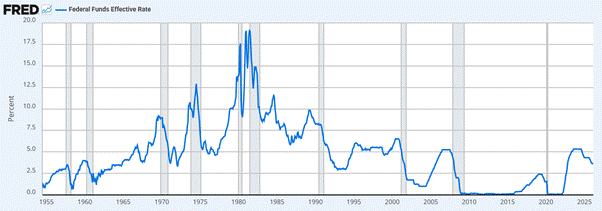
Source: https://fred.stlouisfed.org/, past performance is not indicative of future returns.
Yield Curve Warning Signal Has Reversed
Another important indicator is the spread between:
10-Year Treasury Yield – 3-Month Treasury Yield
When short-term yields exceed long-term yields, the curve inverts. Historically, recessions often followed after the curve later moved back above zero.
That re-steepening process is happening again.
No indicator is perfect, but this is one macro signal worth respecting.
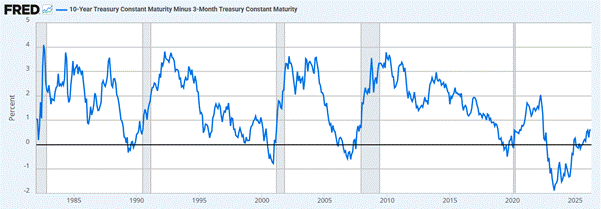
Source: https://fred.stlouisfed.org/, past performance is not indicative of future returns.
What About Market Internals?
Despite ongoing macro concerns, market internals are not yet sending a decisively bearish message. One of the most important gauges to monitor is institutional positioning through the Commitments of Traders (COT) Report, the weekly dataset published by the U.S. Commodity Futures Trading Commission that tracks how major market participants are positioned across futures markets. It allows investors to see whether asset managers, leveraged funds, dealers, and other professional participants are increasing or reducing risk exposure.
Institutional Positioning Remains Constructive
At this stage, positioning from Asset Managers / Institutional traders remains relatively supportive. While there have been some normal fluctuations, we are not seeing the type of aggressive de-risking that typically accompanies major market tops or deeper corrective phases. In previous warning periods — such as 2022 or early 2025 — institutional exposure rolled over clearly before prices weakened materially. Today, that signal is still absent.
This matters because pension funds, mutual funds, insurance groups, and other long-term allocators tend to move more slowly and strategically than short-term speculators. When this category maintains elevated exposure, it often suggests confidence in the broader trend rather than panic or forced selling.
For investors who want to understand how this indicator works and how to interpret professional money flows, Forecaster provides a full guide here: How to Read the COT Report.
In short, while caution is always warranted near record highs, current institutional behavior suggests that the longer-term uptrend still retains an important layer of support rather than showing signs of structural breakdown.
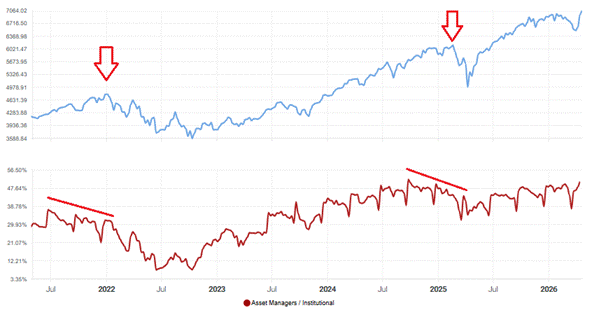
Institutional investors remain heavily positioned in equities, with no clear signs of the large-scale de-risking that preceded previous market corrections. Source: Forecaster Terminal S&P 500 COT report chart. Past performance is not indicative of future returns.
Seasonal Tailwinds Still Exist
Another supportive factor for equities is seasonality. Historically, the period between April and August has often delivered stronger-than-average returns for U.S. stocks, with April, May, June, and especially July showing a high probability of positive performance over time, as highlighted in the table above. This suggests that bullish momentum can still persist in the short term, even if broader risks begin to build beneath the surface.
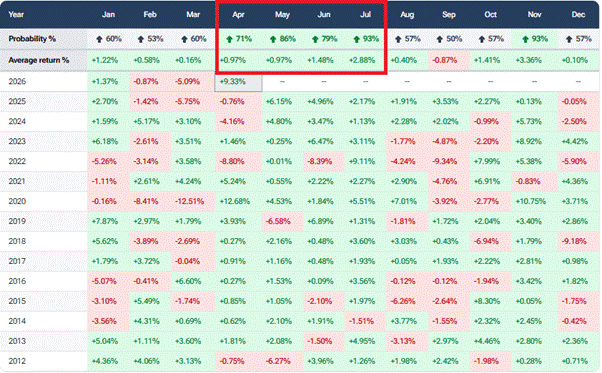
Source: Forecaster.biz Terminal, past performance is not indicative of future returns.
Seasonality should never be used in isolation, but when combined with macro data, positioning, and market internals, it can provide an important timing edge for investors. Those who want to explore this topic in greater depth can learn more through historical stock market seasonality analysis and recurring market patterns.
This material is for informational and educational purposes only and reflects personal opinion. It is not investment advice or a recommendation to buy or sell any security.
Disclosure: Interactive Brokers Third Party
Information posted on IBKR Campus that is provided by third-parties does NOT constitute a recommendation that you should contract for the services of that third party. Third-party participants who contribute to IBKR Campus are independent of Interactive Brokers and Interactive Brokers does not make any representations or warranties concerning the services offered, their past or future performance, or the accuracy of the information provided by the third party. Past performance is no guarantee of future results.
This material is from Forecaster.biz and is being posted with its permission. The views expressed in this material are solely those of the author and/or Forecaster.biz and Interactive Brokers is not endorsing or recommending any investment or trading discussed in the material. This material is not and should not be construed as an offer to buy or sell any security. It should not be construed as research or investment advice or a recommendation to buy, sell or hold any security or commodity. This material does not and is not intended to take into account the particular financial conditions, investment objectives or requirements of individual customers. Before acting on this material, you should consider whether it is suitable for your particular circumstances and, as necessary, seek professional advice.
Disclosure: Futures Trading
Futures are not suitable for all investors. The amount you may lose may be greater than your initial investment. Before trading futures, please read the CFTC Risk Disclosure. A copy and additional information are available at the Warnings and Disclosures section of your local Interactive Brokers website.
Disclosure: ETFs
Any discussion or mention of an ETF is not to be construed as recommendation, promotion or solicitation. All investors should review and consider associated investment risks, charges and expenses of the investment company or fund prior to investing. Before acting on this material, you should consider whether it is suitable for your particular circumstances and, as necessary, seek professional advice.


Join The Conversation
If you have a general question, it may already be covered in our FAQs page. go to: IBKR Ireland FAQs or IBKR U.K. FAQs. If you have an account-specific question or concern, please reach out to Client Services: IBKR Ireland or IBKR U.K..
Visit IBKR U.K. Open an IBKR U.K. Account