


Originally Posted 28 October 2025 – Chart to Watch: Higher valuations supported by stronger fundamentals
Authors: Jeremiah Buckley, CFA and Ian McDonald, CFA
The market has become much less cyclical over time, and valuations have increased alongside growth and quality.
Key takeaways:
- S&P 500 Index sectors focused on growth, stability, and defense have grown from about 60% of the index in 2014 to roughly 74% today. Meanwhile, cyclical sectors have shrunk from roughly 40% to 26%.
- U.S. large-cap market multiples are higher than in recent history, but it is worth noting that the mix of industries within major indexes has shifted toward faster-growing, more profitable sectors that typically command higher multiples.
- Fundamentals are helping to support current valuations: The gap in profitability between growth and value indexes has widened over time, helping explain why the valuation gap has grown as well.
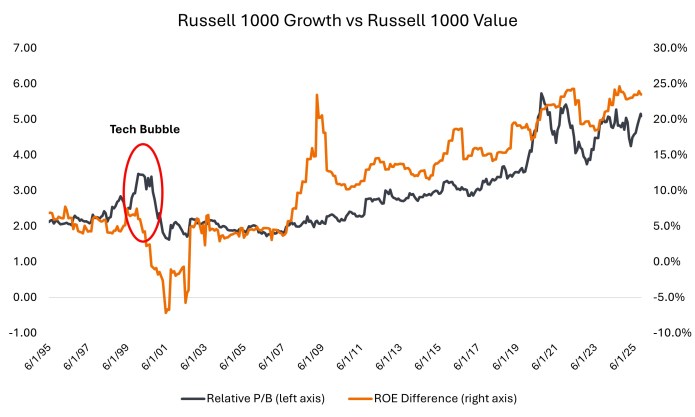
Source: Bloomberg, as of 15 October 2025.
The S&P 500® Index looks very different today than it did a decade ago. Sectors focused on growth, stability, and defense1 have grown from about 60% of the index in 2014 to roughly 74% today. Meanwhile, cyclical sectors2 have shrunk from roughly 40% to 26%.
Energy offers a stark example of shifts in market composition: its weight in the S&P 500 has fallen from approximately 11% in 2014 to about 3% today. The bottom line is that the S&P 500 has become growthier, and market valuations have risen accordingly.
The chart above compares large-cap growth and value indexes on two key measures: valuation (price-to-book ratio, shown on the left axis) and quality (return on equity, shown on the right axis). The comparison highlights a key difference in today’s market versus the tech bubble of 2000.
Growth stocks trade at a wide valuation (price-to-book) premium to value stocks today, but there is a crucial difference from 2000: Fundamentals are helping to support current valuations.
The gap in profitability (return on equity) between growth and value indexes has widened over time, helping explain why the valuation gap has grown as well. Since 2002, increases in price-to-book ratios have been matched by comparable increases in return on equity. During the 2000 tech bubble, by contrast, growth valuations surged without any fundamental support.
“U.S. large-cap market multiples are higher than in recent history, but it is worth taking into account that the mix of industries within major indexes has shifted toward faster-growing, more profitable sectors that typically command higher multiples. Strong recent earnings growth – with similar expectations through year end and into next year – also help justify higher valuations.”
Disclosure: Janus Henderson
The opinions and views expressed are as of the date published and are subject to change without notice. They are for information purposes only and should not be used or construed as an offer to sell, a solicitation of an offer to buy, or a recommendation to buy, sell or hold any security, investment strategy or market sector. No forecasts can be guaranteed. Opinions and examples are meant as an illustration of broader themes and are not an indication of trading intent. It is not intended to indicate or imply that any illustration/example mentioned is now or was ever held in any portfolio. Janus Henderson Group plc through its subsidiaries may manage investment products with a financial interest in securities mentioned herein and any comments should not be construed as a reflection on the past or future profitability. There is no guarantee that the information supplied is accurate, complete, or timely, nor are there any warranties with regards to the results obtained from its use. Past performance is no guarantee of future results. Investing involves risk, including the possible loss of principal and fluctuation of value.
Disclosure: Interactive Brokers Third Party
Information posted on IBKR Campus that is provided by third-parties does NOT constitute a recommendation that you should contract for the services of that third party. Third-party participants who contribute to IBKR Campus are independent of Interactive Brokers and Interactive Brokers does not make any representations or warranties concerning the services offered, their past or future performance, or the accuracy of the information provided by the third party. Past performance is no guarantee of future results.
This material is from Janus Henderson and is being posted with its permission. The views expressed in this material are solely those of the author and/or Janus Henderson and Interactive Brokers is not endorsing or recommending any investment or trading discussed in the material. This material is not and should not be construed as an offer to buy or sell any security. It should not be construed as research or investment advice or a recommendation to buy, sell or hold any security or commodity. This material does not and is not intended to take into account the particular financial conditions, investment objectives or requirements of individual customers. Before acting on this material, you should consider whether it is suitable for your particular circumstances and, as necessary, seek professional advice.


Join The Conversation
If you have a general question, it may already be covered in our FAQs page. go to: IBKR Ireland FAQs or IBKR U.K. FAQs. If you have an account-specific question or concern, please reach out to Client Services: IBKR Ireland or IBKR U.K..
Visit IBKR U.K. Open an IBKR U.K. Account