


Click to view the earnings moves in DLTR
Past performance is not indicative of future results
Dollar Tree’s Earnings Day Slide: What History Tells Us
Dollar Tree (DLTR) took a sharp turn lower today, plunging -9.7% right after reporting its first quarter fiscal 2025 earnings. For investors who track earnings trends, today’s move likely rings a familiar bell—because DLTR’s stock has a strong history of making outsized moves on earnings days.
How Does Today Stack Up to History?
According to historical data, DLTR has averaged a -6.9% return on the day of earnings over the last 12 quarters. Notably, only a third (33.3%) of earnings days finished positive, while two-thirds (66.7%) were down days. The initial gap—measured from previous close to opening price—has also averaged a -5.5% move, with 75% of those gaps heading lower.
For those looking for a bounce during the day, DLTR’s historical open-to-close return has averaged -1.5%, showing that rallies from the open tend to fizzle. The average move to the day’s high is +3.2%, while the drop to the day’s low averages -4.5%, underlining a persistent bias to the downside.
| Stock Performance | Earnings Move | Open Gap | Open to High | Open to Low | Open to Close |
|---|---|---|---|---|---|
| Average Return | -6.9% | -5.5% | +3.2% | -4.5% | -1.5% |
| % of Moves Up | 33.3% | 25.0% | 41.7% | ||
| % of Moves Down | 66.7% | 75.0% | 58.3% |
Past performance is not indicative of future results
For even more stats and in-depth analysis, visit the full historical earnings page here.
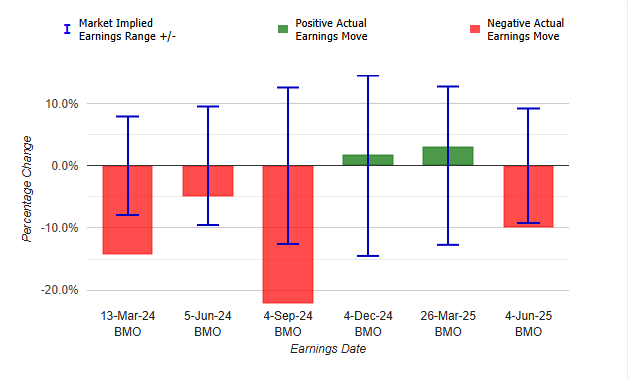
Options Traders Nailed the Move—But Where Do We Go From Here?
It wasn’t just equity investors who braced for volatility. Heading into earnings, the options market was pricing in an expected move of ±9.2% in either direction—and DLTR landed right inside those expectations. Today’s total option volume surged to 52,726 contracts, spotlighting how much attention the earnings event was getting.
Most Actively Traded Option Contract
| Option Contract | 06-Jun-25 90 C |
| Volume | 1,463 |
| VWAP price | 1.23 |
| Open interest | 782 |
| Yesterday’s closing price | 8.18 |
Past performance is not indicative of future results.
The clear standout today was the June 6th, 2025 $90 call, traded 1,463 times (well above its open interest). Despite DLTR trading at $87.24 after earnings, these calls changed hands at an average price of just $1.23—down dramatically from their previous close of $8.18, a reminder of just how quickly option premium can disappear post-event.
What Happens After Earnings? A Look at Post-Earnings Trends
While the average one-day post-earnings return is a modest +0.8%, the trend gets weaker as the days pass: +0.2% two days after, turning into -0.2% three days after, and -0.9% one week later. In fact, upward moves after earnings are less common, with less than 37% of 1- and 2-week periods posting gains.
| Stock Performance | 1 Day After Earnings | 2 Days After Earnings | 3 Days After Earnings | 1 Week After Earnings | 2 Weeks After Earnings |
|---|---|---|---|---|---|
| Average Return | +0.8% | +0.2% | -0.2% | -0.9% | -0.1% |
| % of Moves Up | 36.4% | 54.5% | 27.3% | 27.3% | 36.4% |
| % of Moves Down | 63.6% | 45.5% | 72.7% | 72.7% | 63.6% |
Past performance is not indicative of future results
How Big Can the Swings Get?
When it comes to the magnitude of earnings day swings, DLTR can move big—regardless of direction. The average absolute earnings move is 8.8%, and past moves have ranged as high as 22.2% in either direction.
| Stock Performance | Earnings Move | Open Gap | Open to High | Open to Low | Open to Close |
|---|---|---|---|---|---|
| Absolute Average Return | 8.8% | 6.5% | 3.2% | 4.5% | 3.5% |
| Max Absolute Return | 22.2% | 13.8% | 9.5% | 16.5% | 12.8% |
| Min Absolute Return | 1.9% | 0.0% | 0.1% | 0.3% | 0.5% |
Past performance is not indicative of future results
Takeaway for Investors
DLTR’s history of sharp earnings-day moves, with a notable bias to the downside, suggests today’s reaction is far from unusual. The options market had already braced for this possibility, and the overwhelming interest in short-term, out-of-the-money calls reveals some traders were still hunting for an upside surprise. With DLTR reiterating its sales outlook but trimming EPS guidance, plus ongoing uncertainty around the Family Dollar sale, volatility may stick around.
If you’re eyeing future moves, remember that post-earnings rebounds in DLTR have historically been weak—and that volatility can work both ways. For a deeper dive into DLTR’s earnings trends, check the historical stock performance around earnings page.
Contact Information:
If you have feedback or concerns about the content, please feel free to reach out to us via email at support@marketchameleon.com.
—
Originally Posted June 4, 2025 – DLTR Drops 9.7% on Earnings: Is This Just Another Typical Earnings Selloff?
NOTE: Stock and option trading involves risk that may not be suitable for all investors. Examples contained within this report are simulated and may have limitations. Average returns and occurrences are calculated from snapshots of market mid-point prices and were not actually executed, so they do not reflect actual trades, fees, or execution costs. This report is for informational purposes only, and is not intended to be a recommendation to buy or sell any security. Neither Market Chameleon nor any other party makes warranties regarding results from its usage. Past performance does not guarantee future results. Please consult a financial advisor before executing any trades. You can read more about option risks and characteristics at theocc.com.
The information is provided for informational purposes only and should not be construed as investment advice. All stock price information is provided and transmitted as received from independent third-party data sources. The Information should only be used as a starting point for doing additional independent research in order to allow you to form your own opinion regarding investments and trading strategies. The Company does not guarantee the accuracy, completeness or timeliness of the Information.
Disclosure: Market Chameleon
The information provided on MarketChameleon is for educational and informational purposes only. It should not be considered as financial or investment advice. Trading and investing in financial markets involve risks, and individuals should carefully consider their own financial situation and consult with a professional advisor before making any investment decisions. MarketChameleon does not guarantee the accuracy, completeness, or reliability of the information provided, and users acknowledge that any reliance on such information is at their own risk. MarketChameleon is not responsible for any losses or damages resulting from the use of the platform or the information provided therein. The 7-day free trial is offered for evaluation purposes only, and users are under no obligation to continue using the service after the trial period.
Disclosure: Interactive Brokers Third Party
Information posted on IBKR Campus that is provided by third-parties does NOT constitute a recommendation that you should contract for the services of that third party. Third-party participants who contribute to IBKR Campus are independent of Interactive Brokers and Interactive Brokers does not make any representations or warranties concerning the services offered, their past or future performance, or the accuracy of the information provided by the third party. Past performance is no guarantee of future results.
This material is from Market Chameleon and is being posted with its permission. The views expressed in this material are solely those of the author and/or Market Chameleon and Interactive Brokers is not endorsing or recommending any investment or trading discussed in the material. This material is not and should not be construed as an offer to buy or sell any security. It should not be construed as research or investment advice or a recommendation to buy, sell or hold any security or commodity. This material does not and is not intended to take into account the particular financial conditions, investment objectives or requirements of individual customers. Before acting on this material, you should consider whether it is suitable for your particular circumstances and, as necessary, seek professional advice.
Disclosure: Options Trading
Options involve risk and are not suitable for all investors. For information on the uses and risks of options read the "Characteristics and Risks of Standardized Options" also known as the options disclosure document (ODD). Multiple leg strategies, including spreads, will incur multiple transaction costs.
Disclosure: Futures Trading
Futures are not suitable for all investors. The amount you may lose may be greater than your initial investment. Before trading futures, please read the CFTC Risk Disclosure. A copy and additional information are available at the Warnings and Disclosures section of your local Interactive Brokers website.


Join The Conversation
If you have a general question, it may already be covered in our FAQs page. go to: IBKR Ireland FAQs or IBKR U.K. FAQs. If you have an account-specific question or concern, please reach out to Client Services: IBKR Ireland or IBKR U.K..
Visit IBKR U.K. Open an IBKR U.K. Account