


Beneath the Surface: What Breadth Reveals That Indexes Conceal
Investopedia is partnering with CMT Association on this newsletter. The contents of this newsletter are for informational and educational purposes only, however, and do not constitute investing advice. The guest authors, which may sell research to investors, and may trade or hold positions in securities mentioned herein do not represent the views of CMT Association or Investopedia. Please consult a financial advisor for investment recommendations and services.
Beneath the Surface: What Breadth Reveals That Indexes Conceal
When financial news commentators speak of “the market,” they’re typically referencing price movements in broad, but market-capitalization-weighted (mega-cap-skewed) indexes like the S&P 500 Index or the Nasdaq Composite. These indexes provide an efficient snapshot of capitalization-weighted performance. Still, they are also prone to distortion, especially during periods when only a handful of mega-cap stocks are driving the majority of the gains. Unfortunately, these distortions are often least evident but most dangerous as we approach important market tops.
This is where market breadth analysis becomes essential. By monitoring the number of stocks participating in an uptrend or downtrend, market breadth provides a more nuanced view of internal strength or fragility. As technicians, we know that surface-level signals can be misleading, especially at the index level. Just as a physician wouldn’t assess a patient’s health based solely on outward appearance, we shouldn’t evaluate market vitality based on index prices alone. Breadth indicators are the diagnostic tools we use to look beneath the surface.
The Objective Lens of Breadth
Market breadth analysis is grounded in simplicity. It measures participation: How many stocks are advancing versus declining? How many are hitting new highs or new lows? Are more stocks trading above their moving averages, or below?
Because breadth relies on straightforward, quantitative data with minimal subjective interpretation, it offers an exceptionally objective perspective. It doesn’t chase narratives or get swayed by macroeconomic forecasts or earnings speculation. Instead, breadth reflects how many individual stocks are truly supporting the market trend, capturing the collective sentiment of millions of market participants as they digest all available information.
This objectivity is why breadth indicators have stood the test of time as some of the most reliable early warning signals for emerging market risks. While other forms of analysis can falter amid emotional or speculative extremes, breadth remains remarkably resilient, immune to bias and anchored in pure market reality.
Divergences: The Psychology Behind Breadth Breakdowns
Through decades of market cycles, one pattern consistently stands out: deterioration in market breadth nearly always precedes tops in large-cap-weighted indexes. While this is often and rightly discussed in terms of declining stock participation, it’s crucial to recognize the deeper behavioral forces at play.
Expressions of this deterioration typically manifest as negative divergences between breadth indicators and major price indexes, where prices continue to rise while breadth measures trend lower. These divergences are not just technical anomalies—they are windows into market psychology. Negative divergences reflect the persistent interplay of fear and greed, two of the most potent emotional drivers of investor behavior.
During these periods, the market offers fewer stocks that appear attractively priced or fundamentally sound. Investors, consciously or not, begin consolidating capital into a narrow group of perceived “safe” leaders—typically the largest and most well-capitalized stocks. On the surface, this flight to safety looks rational. However, beneath this lies a contradiction: investors are fearful of risk, yet unwilling to miss the final stages of a bull market.
This paradox—the simultaneous fear of loss and fear of missing out—creates the conditions for breadth divergence. It’s a subtle yet telling sign that the foundation of the rally is weakening, even as the indexes continue to march to new highs. Divergences, then, are more than technical cues—they’re manifestations of a changing emotional undercurrent in the market.
Since divergences reflect human psychology—which does not change over time—they should be viewed as enduring characteristics of the stock market and significant turning points. This consistency across decades makes breadth divergences among the most reliable and timeless signals of trend exhaustion.
Seeing More with Breadth
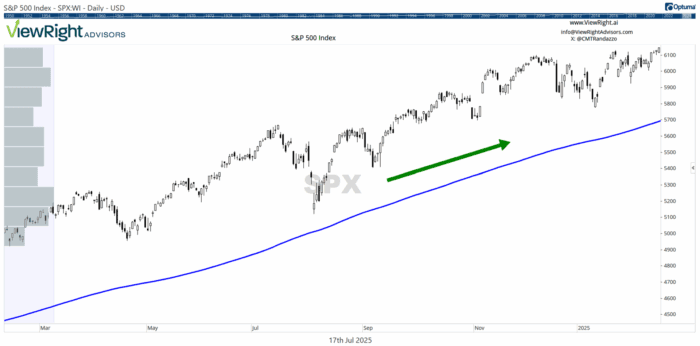
Charts of the S&P 500 often appear healthy, like the one below, steadily climbing through February 2025 above its rising 200-day moving average:

Past performance is not indicative of future results
But by adding a simple breadth measure like the NYSE Advance-Decline Line, the picture changes dramatically:
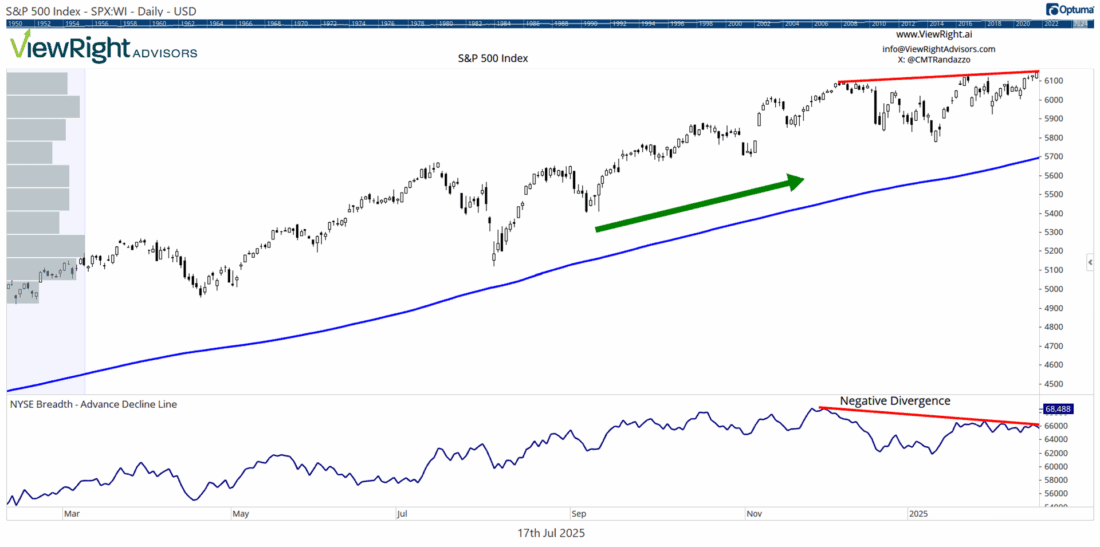
Past performance is not indicative of future results
What appeared to be a smooth uptrend is revealed to be masking internal deterioration. The Advance-Decline Line failed to confirm the new highs, flashing a negative divergence and offering early warning that fewer stocks were driving the gains.
This single overlay transforms the chart from a story of strength to a sign of fragility, illustrating why breadth remains a powerful yet underutilized tool in market analysis.
Market of Stocks, Not Just the Stock Market
The behavioral context reinforces a core truth: the stock market is not a monolith. It is a market of stocks, each reflecting unique supply and demand dynamics. Most publicly traded companies are small- and mid-cap firms, far removed from the elite few that dominate index weightings.
In late-stage bull markets—most notably in 2000, 2007, and more recently in 2021—the major indexes appeared healthy even as the majority of stocks quietly began to falter. The illusion of strength persisted until price finally caught down to breadth.
This narrowing of participation, obscured by strong headline index performance, is what makes divergence analysis so critical. Breadth metrics like the NYSE Advance-Decline Line, percentage of stocks above moving averages, or the number of new highs versus new lows help technicians see through the illusion and assess true underlying health.
Breadth and Momentum as Fragility Signals
A compelling combination occurs when deteriorating breadth is confirmed by weakening momentum. Momentum measures the rate of price change. When momentum falters, even in the presence of rising prices, it often signals that internal strength is fading.
Rather than chasing lagging fundamentals or reacting to shifting narratives or correlations, evaluating the cumulative impact of market forces via breadth and momentum can offer a forward-looking edge. In our work, we’ve found that significant market tops are usually accompanied by narrowing participation and declining momentum.
One helpful analogy is that of a freight train. Imagine strong breadth and leadership as a long, powerful train—multiple engines pulling an extended line of cars at full speed. This train is difficult to stop and even more challenging to reverse. Weak breadth, by contrast, resembles a much shorter train with only one or two engines and a sparse set of cars decelerating. That train can stop—and reverse course—with far less effort.
The takeaway? When more stocks are participating in an uptrend, the market is resilient. When fewer stocks are doing the work, the market becomes fragile.
Applications for Risk Management and Tactical Shifts
From a tactical perspective, breadth analysis allows for a more proactive approach to managing exposure. Rather than waiting for price breakdowns to trigger reactionary moves, breadth can guide incremental adjustments in positioning. For example, when breadth indicators turn lower while price indexes are still elevated, it may warrant reducing exposure, moving capital to what’s still working, or shifting into more defensive sectors. Conversely, when breadth begins to expand from the bottom, it can be an early signal of a sustainable uptrend, before it’s confirmed by price.
This is especially valuable for those managing long-only portfolios or operating within constraints that limit leverage or shorting. Breadth enables a more dynamic approach to risk, reducing exposure when fragility builds, and increasing it when broad participation resumes.
At ViewRight Advisors, this forms the backbone of our tactical equity overlay: adapting to market health rather than attempting to predict it or simply reacting after internal weakness has already been reflected in price.
Conclusion: Simplicity with Predictive Power
In a landscape increasingly dominated by complex models, machine learning, and high-frequency signals, it’s worth remembering that some of the most effective market tools remain the simplest. Breadth analysis—tracking how many stocks are contributing to the market’s movement—provides a timeless edge rooted in participation, not prediction.
By understanding and applying breadth, we transition from reacting to market symptoms to diagnosing the underlying structural health. That shift allows for more timely, evidence-based decisions—and a more resilient investment process.
Applying Breadth Concepts in Today’s Market
Breadth and divergence analysis remain vital tools for interpreting market strength beneath the surface, and recent conditions offer a clear example of why. In early 2025, the S&P 500’s rally to new highs in February occurred alongside weakening internal strength, hallmarks of a potential market top, that preceded a nearly 20% drawdown. Today, with many stocks having rebounded and indexes testing those February highs, breadth has improved significantly, offering more favorable odds of continued gains. A recent Chart Advisor newsletter explores this shift in detail.
—
Originally posted 18th July 2025
Disclosure: Investopedia
Investopedia.com: The comments, opinions and analyses expressed herein are for informational purposes only and should not be considered individual investment advice or recommendations to invest in any security or to adopt any investment strategy. While we believe the information provided herein is reliable, we do not warrant its accuracy or completeness. The views and strategies described on our content may not be suitable for all investors. Because market and economic conditions are subject to rapid change, all comments, opinions and analyses contained within our content are rendered as of the date of the posting and may change without notice. The material is not intended as a complete analysis of every material fact regarding any country, region, market, industry, investment or strategy. This information is intended for US residents only.
Disclosure: Interactive Brokers Third Party
Information posted on IBKR Campus that is provided by third-parties does NOT constitute a recommendation that you should contract for the services of that third party. Third-party participants who contribute to IBKR Campus are independent of Interactive Brokers and Interactive Brokers does not make any representations or warranties concerning the services offered, their past or future performance, or the accuracy of the information provided by the third party. Past performance is no guarantee of future results.
This material is from Investopedia and is being posted with its permission. The views expressed in this material are solely those of the author and/or Investopedia and Interactive Brokers is not endorsing or recommending any investment or trading discussed in the material. This material is not and should not be construed as an offer to buy or sell any security. It should not be construed as research or investment advice or a recommendation to buy, sell or hold any security or commodity. This material does not and is not intended to take into account the particular financial conditions, investment objectives or requirements of individual customers. Before acting on this material, you should consider whether it is suitable for your particular circumstances and, as necessary, seek professional advice.


Join The Conversation
If you have a general question, it may already be covered in our FAQs page. go to: IBKR Ireland FAQs or IBKR U.K. FAQs. If you have an account-specific question or concern, please reach out to Client Services: IBKR Ireland or IBKR U.K..
Visit IBKR U.K. Open an IBKR U.K. Account