


Stocks and Treasuries are appreciating further after the Fed cut rates yesterday and announced a plan to purchase $40 billion in T-bills per month to shore up liquidity in the financial system. Upgrades to the central bank’s growth projections alongside downgrades to its inflation estimates were music to the ears of equity and bond bulls alike, as the two developments support an expansion in corporate earnings as well as cheaper borrowing costs. Emblematic of stronger sentiment across reacceleration trades is every sector advancing in equities minus technology, which is facing a battering following a disappointing quarterly report from Oracle with cloud sales missing expectations and capital expenditure intentions increasing meaningfully. Softer-than-expected revenues amidst commitments of more incremental dollars to AI infrastructure has investors questioning the investment return prospects of the modern technology, as shares of each magnificent seven name retreat. The cyclically oriented, rate sensitive areas of the equity market are thriving, with the Dow Jones Industrial Average reaching a fresh record and the Russell 2000 touching an all-time high for the third consecutive session. Economic data this morning didn’t stand in the way of the rally in everything outside of tech, as unemployment claims are being overlooked due to their volatile behavior during the holidays and the US trade deficit shrunk to its narrowest point since 2020. Elsewhere, the yield curve is descending in bull-flattening fashion, led south by duration, which is detrimental to the greenback and serving losses to the dollar.
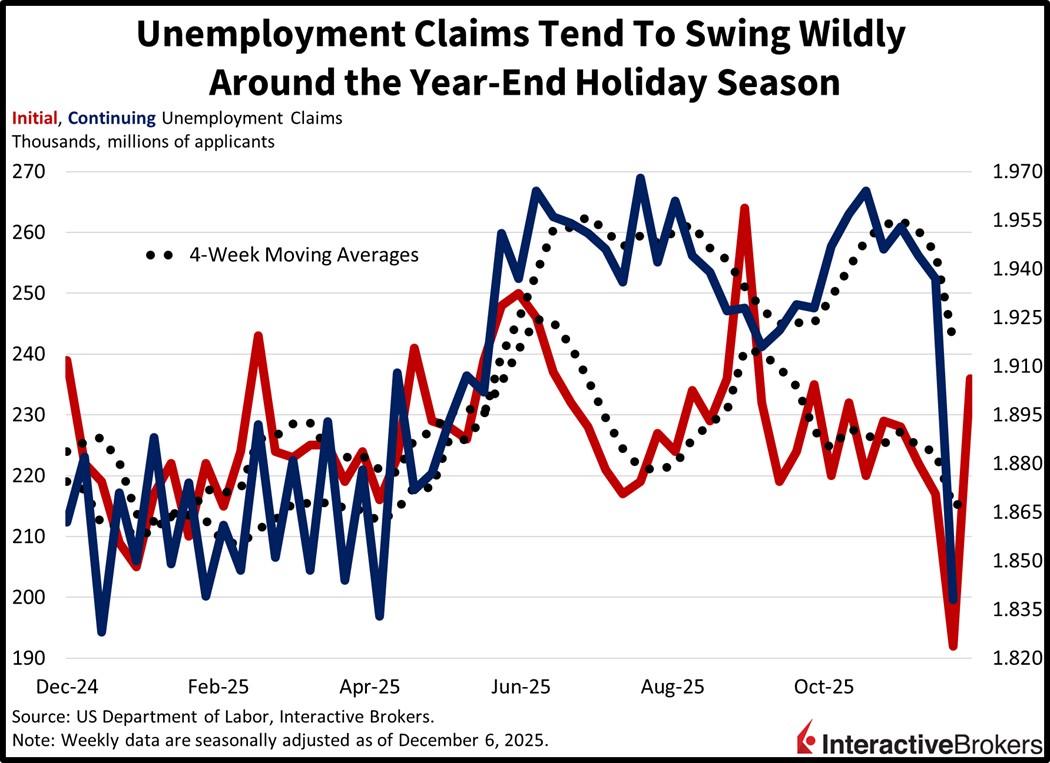
Claims Out-of-Whack During Volatile Period
Unemployment claims remained volatile in the last two weeks as the year-end holiday periods tend to generate out-of-whack swings. Indeed, initial applications rose from their lowest point in 38 months of 192k, to their highest level in 13 weeks of 236k during the seven-day interval ended Dec. 6. The result was well above the 220k consensus estimate. Continuing filings, meanwhile, sank to a seven-month low of 1.838 million for the week culminating on Nov. 29, significantly below the 1.950 million forecast and the previous report’s 1.937 million. Four-week moving averages shifted in bifurcated fashion, from 214.75k and 1.945 million to 216.75k and 1.918 million.
Past performance does not guarantee future results.
Fed Cuts, Dots Bolstered Cyclical Rally
Today’s trading action consisting of fading AI enthusiasm amidst robust animal spirits across sectors minus tech is likely to be a preview of the broadening we are set to see in 2026. Indeed, fresh records on the Dow Jones Industrial and Russell 2000 are reflecting the tailwinds geared to benefit the two indices which are cyclically oriented, rate sensitive and increasingly domestically focused. The AI trade may take a back seat to new leadership as we turn the calendar with the economy picking up steam against the backdrop of a reopened government and thriving capital markets. Additionally, President Trump’s signature tax legislation passed in 2025 is poised to bolster earnings in 2026 via lighter taxation expenses and enhanced depreciation write offs which will buoy dividends, share buyback programs and investor sentiment. Furthermore, liquidity support from the Fed by way of three consecutive quarter-point cuts to end this year, the resumption of Treasury asset purchases and perhaps more benchmark reductions can increase the possibility of valuation expansion. Finally, the small-cap Russell 2000 is still roughly flat from its high in 2021, a time when overnight yields were 0, and can rally upwards of 20% in an environment of GDP growth in excess of 3% alongside monetary policy accommodation, a path that is certainly widening at this juncture.
International Roundup
Canada Goods Trade Turns Positive
Canada produced a marginal trade surplus in September after weathering seven months of imports exceeding the value of products shipped abroad. In a related matter, the country’s services trade surplus, at $200 million, roughly matched August’s results.
In September, the value of products shipped abroad climbed 6.3% to $64.2 billion. It was the largest increase since February 2024. Simultaneously, purchases of products from foreign lands slipped 4.1% to slightly more than $64 billion, resulting in a $150 million surplus. The following items and their growth rates were the most significant contributors to the positive export number:
- Aircraft and transportation equipment, 23.4%
- Metal and non-metallic minerals, 22.7%
- Energy products, 5.8%
Among imports, 7 of 11 categories experienced declines with the metal and non-metallic minerals group and consumers goods classification dropping 27.8% and 6%, respectively.
And Household Wealth Grows
Households in Canada grew their wealth 2.6% during the three months ended in September. It was the eighth consecutive quarter of growth and the fastest uptick since the first three months of 2024. While liabilities, such as mortgages and other debt ascended, equity market performance and the appreciation of foreign assets due to a declining Canadian dollar shored up balance sheets.
Australia’s Unemployment Rate Lower than Anticipated
Australia’s November unemployment rate matched October’s 4.3% level and was a tad lower than the economist consensus estimate of 4.4%. Payrolls, however, sank by 21.3k after climbing by 41.1k in the preceding month. Economists anticipated a gain of 20k. The growth of part-time employees partially offset a 56.5k drop in the number of individuals employed full time. Meanwhile, the share of the country’s working age population that is either seeking employment or currently hitting a time clock sank from 66.9% to 66.7%, well below the economist consensus estimate of 67%.
Sentiment Among Large Japanese Businesses Climbs
The Business Survey Index from Japan’s Cabinet Office recorded a score of 4.7 for large manufacturers in the fourth quarter, a gain from 3.8% in the three-month time frame ended in June. The services industry counterpart, meanwhile, fell marginally to 5.1.
Disclosure: Interactive Brokers Affiliate
Information posted on IBKR Campus that is provided by third-parties does NOT constitute a recommendation that you should contract for the services of that third party. Third-party participants who contribute to IBKR Campus are independent of Interactive Brokers and Interactive Brokers does not make any representations or warranties concerning the services offered, their past or future performance, or the accuracy of the information provided by the third party. Past performance is no guarantee of future results.
This material is from IBKR Macroeconomics, an affiliate of Interactive Brokers LLC, and is being posted with its permission. The views expressed in this material are solely those of the author and/or IBKR Macroeconomics and Interactive Brokers is not endorsing or recommending any investment or trading discussed in the material. This material is not and should not be construed as an offer to buy or sell any security. It should not be construed as research or investment advice or a recommendation to buy, sell or hold any security or commodity. This material does not and is not intended to take into account the particular financial conditions, investment objectives or requirements of individual customers. Before acting on this material, you should consider whether it is suitable for your particular circumstances and, as necessary, seek professional advice.


Join The Conversation
If you have a general question, it may already be covered in our FAQs page. go to: IBKR Ireland FAQs or IBKR U.K. FAQs. If you have an account-specific question or concern, please reach out to Client Services: IBKR Ireland or IBKR U.K..
Visit IBKR U.K. Open an IBKR U.K. Account