


Originally Posted, 12 June 2025 – Arming for growth: Q1 2025 results validate Europe’s defence re-armament
Key Takeaways
- Europe’s defence budgets are rising sharply, fuelling a “generation-long” demand curve for military contractors.
- Q1 earnings showed almost 19% weighted revenue growth and widening margins despite heavy R&D investment.
- Record-high backlogs—averaging 38× monthly sales—underscore unprecedented order visibility.
- Pure-play defence firms outperformed best, while diversified suppliers offer stability and critical subsystems.
Europe’s politicians are finally putting money where their security rhetoric is. 2024 defence outlays across NATO-Europe jumped 17% to about €326 bn1, and Brussels now insists that at least 65% of new procurement be sourced inside Europe.2 Germany’s €100bn Sondervermögen, Poland’s move towards 4% of GDP3, and the UK’s pledge to reach 2.5% of GDP by 2030 collectively mark the biggest remilitarisation since the Cold War.
Charting the policy shift, NATO4 scenarios (2.5-3.5% of GDP) imply Europe could be spending €800-950bn a year on defence by 2030, more than double 2024 levels (Figure 1). Equipment outlays—the part that flows straight to contractors—would climb fastest.
Figure 1: NATO Europe defence—spending scenarios
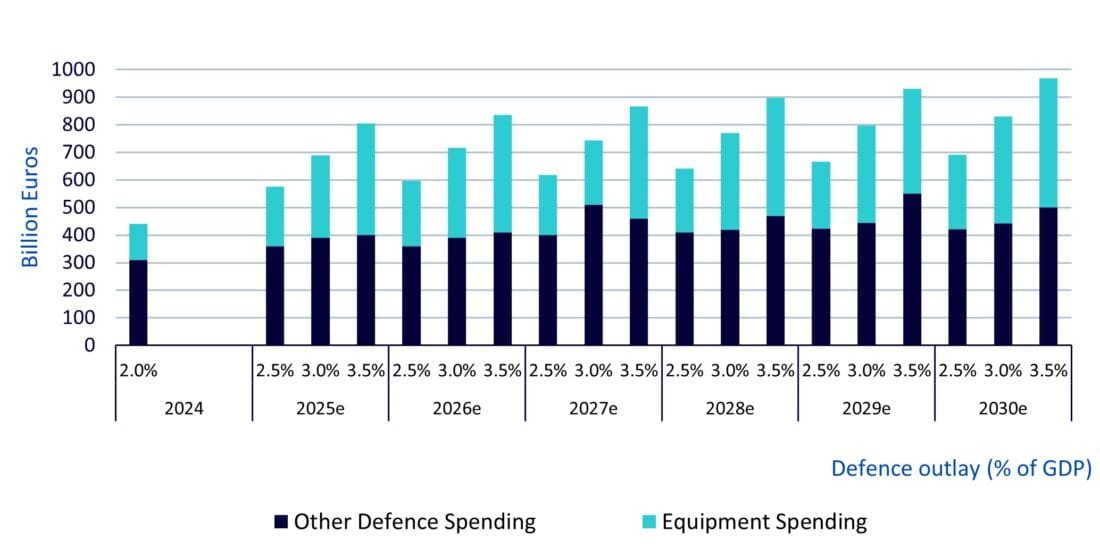
Source: Rheinmetall, WisdomTree as of 31 January 2025. Forecasts are not an indicator of future performance and any investments are subject to risks and uncertainties.
Industrial policy is lending further support; the European Defence Fund is conditioning grants on European content. As Europe seeks greater autonomy in defence, the leaders want tighter control of critical supply chains, from missiles to tanks. The upshot is a long, visible demand curve for Europe’s defence companies.
Q1 2025 earnings: what the numbers say
Focusing on the WisdomTree Europe Defence UCITS Index—designed to capture companies with meaningful revenue from the European defence megatrend—14 of 24 constituents had reported Q1 figures by 16 May. The snapshot is encouraging:
Sales growth
Headline growth remained robust; 13 of the 14 companies reported revenue growth in Q1, with the average sales growth rate at +17.7% (LTM5 sales growth rate year-over-year (YoY)). Stack these data points next to the five-year trend and the trajectory is unmistakable. Weighted revenue growth has swung from a pandemic trough of -8% in 2021 to +19% in May 2025 (Figure 3). Land-systems champion Rheinmetall led the charge with a 42% jump, but momentum was widespread: HENSOLDT, Kongsberg, Safran and Leonardo all posted double-digit growth rates. Only one name, Kitron, contracted—and that was due to destocking in its non-defence connectivity arm rather than weaker military demand.
Figure 2: Year-over-year sales growth of index holdings reporting Q1 earnings as of 16 May 2025
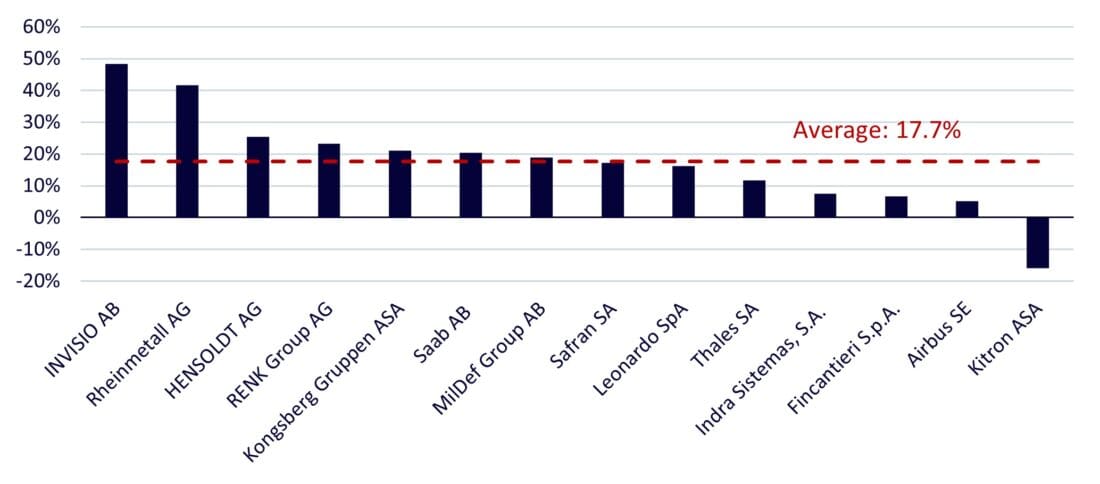
Source: WisdomTree, Bloomberg. Year-over-year sales based on the latest twelve months (LTM) vs prior LTM as of 16 May 2025. You cannot invest directly in an index. Historical performance is not an indication of future performance and any investments may go down in value.
Figure 3: Weighted average year-over-year sales growth of the WisdomTree Europe Defence UCITS Index
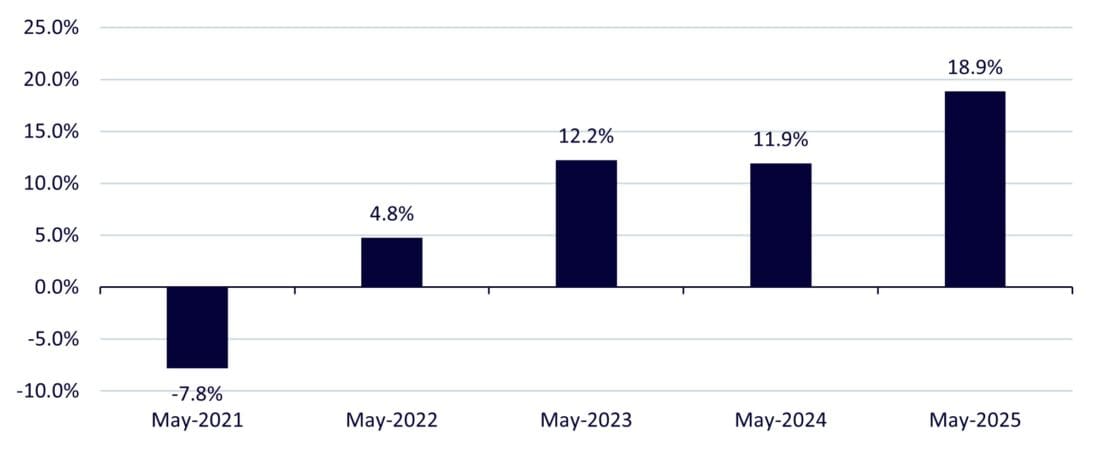
Source: WisdomTree, Bloomberg. Year-over-year sales based on the latest twelve months (LTM) vs prior LTM as of 16 May 2025. Holding weights are fixed as of 16 May 2025. All holdings in the WisdomTree Europe Defence UCITS Index with available data are included in the calculation. You cannot invest directly in an index. Historical performance is not an indication of future performance and any investments may go down in value.
Consensus beats and management tone
Roughly half the cohort beat6 on both revenue and EBIT. Rheinmetall, Thales and Safran cited “accelerating European demand”, whereas misses were generally idiosyncratic: supply-chain timing (Saab, HENSOLDT) or tough comparisons (INVISIO). Crucially, no company cut 2025 guidance. CEOs repeatedly flagged EU budget trajectories and multi-year frameworks as reasons for confidence.
Order book boom
The real story, however, lies in the order books. The index’s simple average ratio of backlog to monthly sales climbed to 38 times in May from around 25 times before the Russia-Ukraine War. For the five largest holdings, as of 16 May 2025, it has crossed the 40× mark. Rheinmetall booked €5 billion of orders in a single quarter, Fincantieri lifted its firm naval backlog 34% YoY to €31 billion (around 4 times of its annual revenue), and HENSOLDT, bolstered by Eurofighter radar contracts, set a new company record. Management commentary was generally confident, citing European procurement timetables, multi-year framework agreements and replenishment of munitions stocks as key tailwinds.
Figure 4: Average backlog-to-monthly-sales ratio of holdings in the WisdomTree Europe Defence UCITS Index
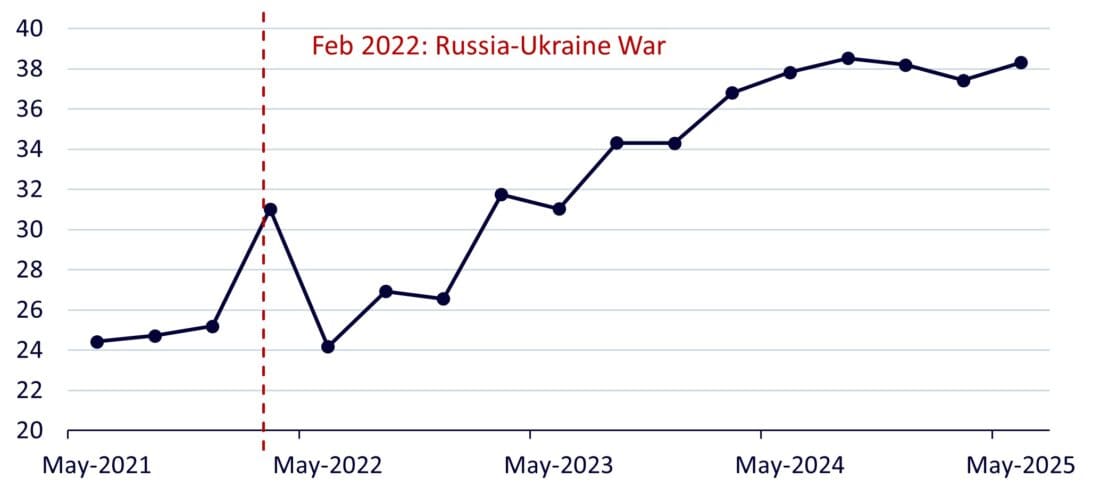
Source: WisdomTree, Bloomberg. For each holding, backlog to monthly sales ratio calculated as Order Backlog Value / (Trailing 12M Net Sales/12). Data as of 16 May 2025. All holdings in the WisdomTree Europe Defence UCITS Index with available data are included in the calculation. You cannot invest directly in an index. Historical performance is not an indication of future performance and any investments may go down in value.
As both revenue growth and backlog cover have risen in recent years, we believe that the budget up-cycle is already flowing through to contracts and profitable growth—well before many of the headline programs (for example, Eurodrone, European Main Battle Tank, GCAP etc.) move into full-rate production.
Exposure intensity and market rewards
The Index groups members by exposure score—a rule in its methodology that tags how much of each company’s revenue comes from defence:
- Score 3: > 50%
- Score 2: 25-50%
- Score 1: 10-25%
Figure 5: Index weight, median sales growth and median 1-year performance by exposure score
| Exposure score | Index weight | Median Sales growth | Median 1-yr performance |
|---|---|---|---|
| 3 | 70.8% | 17.6% | +101% |
| 2 | 15.2% | 6.8% | +90% |
| 1 | 14.0% | 5.2% | +23% |
Source: WisdomTree, Bloomberg. Data as of 16 May 2025. Sales growth is year-over-year based on the latest twelve months (LTM) versus prior LTM as of 16 May 2025. All holdings in the WisdomTree Europe Defence UCITS Index with available data are included in the calculation. You cannot invest directly in an index. Historical performance is not an indication of future performance and any investments may go down in value.
Unsurprisingly, the group with high revenue exposure to defence is showing the fastest top-line gains and the strongest equity performance—Rheinmetall, RENK and HENSOLDT have all at least doubled over the past year. Such companies account for around 70% in the current portfolio. But keeping companies with a lower exposure score, such as Airbus and Rolls-Royce, makes strategic sense, as these firms supply propulsion and subsystems that sit at the heart of Europe’s re-armament programmes, and their civil diversification dampens programme-specific risk. Moreover, several companies with a lower exposure score have begun expanding their defence business: Safran’s acquisition of Collins Aerospace’s actuation assets will lift its defence share, while Airbus’s “EuropaSat” joint venture with Thales boosts secure-comms exposure. Retaining this blend balances pure-play torque with industrial breadth.
Outlook: visibility extends beyond the decade
Order books at 38× monthly sales give contractors unmatched revenue visibility. With Brussels tying funding to European content and new cross-border programmes (Eurodrone, FMBT, GCAP) entering the award phase, demand looks set to compound. Risks, such as supply bottlenecks, election noise, and tariff flare-ups, need monitoring, but no management team currently sees them derailing guidance. Even if NATO-Europe stops at 3% of GDP (middle scenario), listed defence revenues could still double by 2030. The supercycle remains alive and well.
1Politico: EU defense spending projected to boom to €326B
2Reuters: EU envoys reach deal on 150 billion euro arms fund
3Gross domestic product.
4The North Atlantic Treaty Organization is an intergovernmental transnational military alliance of 32 member states.
5LTM = last twelve months.
6“Beat” means a company reported revenue that came in above what analysts were expecting, while a “miss” means it came in below those estimates.
Disclosure: WisdomTree Europe
This material is prepared by WisdomTree and its affiliates and is not intended to be relied upon as a forecast, research or investment advice, and is not a recommendation, offer or solicitation to buy or sell any securities or to adopt any investment strategy. The opinions expressed are as of the date of production and may change as subsequent conditions vary. The information and opinions contained in this material are derived from proprietary and non-proprietary sources. As such, no warranty of accuracy or reliability is given and no responsibility arising in any other way for errors and omissions (including responsibility to any person by reason of negligence) is accepted by WisdomTree, nor any affiliate, nor any of their officers, employees or agents. Reliance upon information in this material is at the sole discretion of the reader. Past performance is not a reliable indicator of future performance.
Please click here for our full disclaimer.
Jurisdictions in the European Economic Area (“EEA”): This content has been provided by WisdomTree Ireland Limited, which is authorised and regulated by the Central Bank of Ireland.
Jurisdictions outside of the EEA: This content has been provided by WisdomTree UK Limited, which is authorised and regulated by the United Kingdom Financial Conduct Authority.
Disclosure: Interactive Brokers Third Party
Information posted on IBKR Campus that is provided by third-parties does NOT constitute a recommendation that you should contract for the services of that third party. Third-party participants who contribute to IBKR Campus are independent of Interactive Brokers and Interactive Brokers does not make any representations or warranties concerning the services offered, their past or future performance, or the accuracy of the information provided by the third party. Past performance is no guarantee of future results.
This material is from WisdomTree Europe and is being posted with its permission. The views expressed in this material are solely those of the author and/or WisdomTree Europe and Interactive Brokers is not endorsing or recommending any investment or trading discussed in the material. This material is not and should not be construed as an offer to buy or sell any security. It should not be construed as research or investment advice or a recommendation to buy, sell or hold any security or commodity. This material does not and is not intended to take into account the particular financial conditions, investment objectives or requirements of individual customers. Before acting on this material, you should consider whether it is suitable for your particular circumstances and, as necessary, seek professional advice.


Join The Conversation
If you have a general question, it may already be covered in our FAQs page. go to: IBKR Ireland FAQs or IBKR U.K. FAQs. If you have an account-specific question or concern, please reach out to Client Services: IBKR Ireland or IBKR U.K..
Visit IBKR U.K. Open an IBKR U.K. Account