


Understanding equity market behavior often requires stepping back from short-term narratives and focusing on long-term statistical tendencies. Two of the most widely studied historical frameworks for U.S. equities are seasonality and the U.S. presidential cycle. While neither framework provides forecasts or guarantees, both can offer useful context when assessing potential market conditions in future years.
This article examines these two dimensions with a specific focus on 2026, drawing exclusively on historical data from the S&P 500.
Seasonal Patterns in the S&P 500: A Long-Term Statistical View
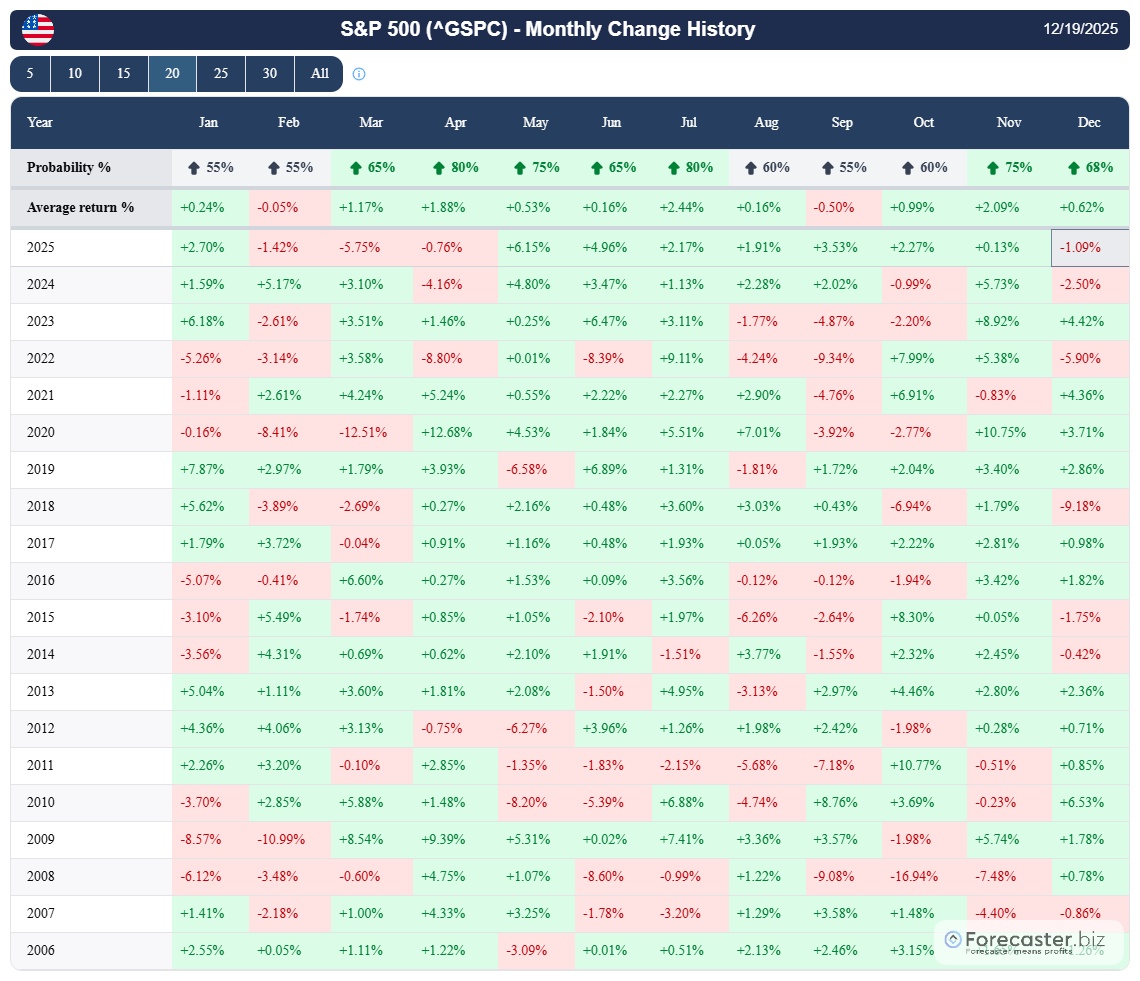
Seasonality analysis examines how markets have historically behaved during specific periods of the year. When applied to the S&P 500, long-term monthly data highlights recurring tendencies, including differences in average returns and the frequency of positive outcomes across months.
Based on historical monthly data, the S&P 500 has shown:
- A higher probability of positive returns in spring and early summer months, particularly from March through July.
- More mixed or weaker statistical performance during late summer and early autumn, with September historically standing out as one of the less favorable months.
- A tendency for year-end strength, especially in November and December, where both average returns and positive-month frequencies have been relatively high.
These patterns are derived from multi-decade observations and represent averages rather than deterministic outcomes. Individual years can, and often do, deviate meaningfully from these historical norms.
Past performance is not indicative of future results.
Historical monthly returns of the S&P 500, including average returns and the frequency of positive months (“Probability %”). The table highlights recurring seasonal tendencies across calendar months, providing statistical context rather than predictive signals. Source: S&P 500 seasonality table.
Interpreting 2026 Through the Lens of Seasonality: The Presidential Cycle
From a calendar perspective, 2026 does not differ structurally from other years. As such, any seasonal tendencies observed historically would, in theory, apply equally to 2026. However, seasonality should be interpreted as contextual information, not as a predictive signal.
For example, while the data shows that certain months have historically exhibited higher average returns, these averages include a wide dispersion of outcomes. Macroeconomic conditions, monetary policy, earnings cycles, and geopolitical developments can easily outweigh seasonal effects in any given year.
In short, seasonality provides a statistical backdrop, not a directional forecast for 2026.
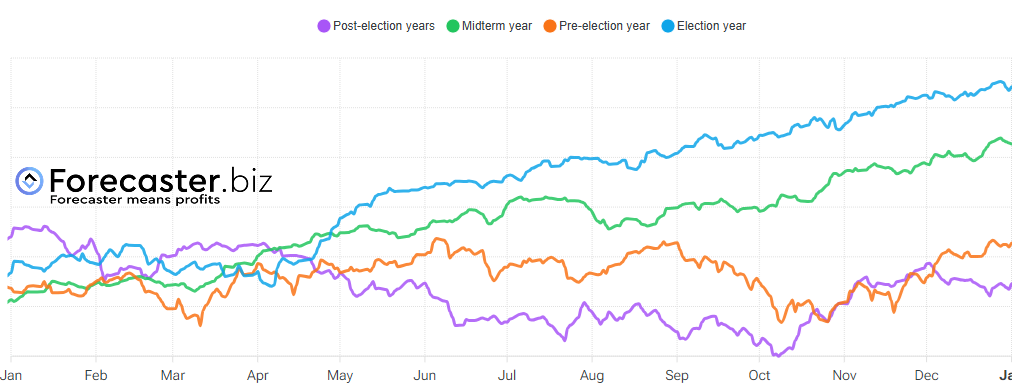
Another commonly referenced framework is the U.S. presidential cycle, which categorizes market behavior based on the four-year election cycle:
- Election year
- Post-election year
- Midterm year
- Pre-election year
Historically, the S&P 500 has displayed different average performance profiles across these phases. Over long time horizons:
- Midterm years have often been associated with higher volatility but also relatively strong full-year returns.
- Pre-election years have historically shown comparatively strong average performance.
- Post-election years, while positive on average, have tended to exhibit more moderate returns relative to other phases.
- Election years have often delivered positive but uneven performance, influenced by policy uncertainty and shifting expectations.
Past performance is not indicative of future results.
Historically, the midterm year (green line) has delivered one of the strongest full-year performances within the U.S. presidential cycle. However, returns have often been uneven: periods of weakness and elevated volatility tend to concentrate in the first half of the year, followed by a more constructive second half. In this context, 2026—a midterm year—fits a historical pattern where short-term drawdowns may precede a recovery later in the year, resulting in above-average outcomes over the full calendar year.. Source: forecaster Terminal S&P 500 Seasonality page
These observations reflect aggregated historical behavior and should not be interpreted as causal relationships.
Where 2026 Fits in the Presidential Cycle
The year 2026 falls into a U.S. midterm year, a phase of the presidential cycle that has historically stood out in terms of aggregate market outcomes. Based on long-term S&P 500 data, approximately 87% of midterm years have ended with positive full-year returns, with an average annual performance exceeding 19%.
When compared with other phases of the presidential cycle, midterm years have shown a higher consistency of positive outcomes than post-election years, and stronger average returns than both post-election and pre-election phases. Election years have also historically delivered solid results, but with slightly lower consistency than midterm years over long samples.
Despite these favorable historical averages, midterm years have often been characterized by elevated volatility and uneven performance within the year, particularly during the first half. As with all cycle-based analyses, these figures describe historical tendencies rather than future expectations, and outcomes in individual years have varied significantly depending on macroeconomic and financial conditions.

Historical data indicate that midterm years have closed in positive territory in roughly 87% of cases, with an average annual return above 19%. Compared with post-election and pre-election, midterm phases have combined higher return consistency with strong average performance. Source: S&P 500 Seasonality page on Forecaster Terminal
That said, midterm years have also produced a wide range of outcomes, including periods of significant stress. As with seasonality, the presidential cycle highlights tendencies, not certainties.
Past performance is not indicative of future results.
—
Originally Posted on December 19, 2025
Disclosure: Interactive Brokers Third Party
Information posted on IBKR Campus that is provided by third-parties does NOT constitute a recommendation that you should contract for the services of that third party. Third-party participants who contribute to IBKR Campus are independent of Interactive Brokers and Interactive Brokers does not make any representations or warranties concerning the services offered, their past or future performance, or the accuracy of the information provided by the third party. Past performance is no guarantee of future results.
This material is from Forecaster.biz and is being posted with its permission. The views expressed in this material are solely those of the author and/or Forecaster.biz and Interactive Brokers is not endorsing or recommending any investment or trading discussed in the material. This material is not and should not be construed as an offer to buy or sell any security. It should not be construed as research or investment advice or a recommendation to buy, sell or hold any security or commodity. This material does not and is not intended to take into account the particular financial conditions, investment objectives or requirements of individual customers. Before acting on this material, you should consider whether it is suitable for your particular circumstances and, as necessary, seek professional advice.
Disclosure: ETFs
Any discussion or mention of an ETF is not to be construed as recommendation, promotion or solicitation. All investors should review and consider associated investment risks, charges and expenses of the investment company or fund prior to investing. Before acting on this material, you should consider whether it is suitable for your particular circumstances and, as necessary, seek professional advice.
Disclosure: Security Futures
Security futures involve a high degree of risk and are not suitable for all investors. The amount you may lose may be greater than your initial investment. Before trading security futures, please read the Security Futures Risk Disclosure Statement. For a copy visit the Warnings and Disclosures section of your local Interactive Brokers website.


Join The Conversation
If you have a general question, it may already be covered in our FAQs page. go to: IBKR Ireland FAQs or IBKR U.K. FAQs. If you have an account-specific question or concern, please reach out to Client Services: IBKR Ireland or IBKR U.K..
Visit IBKR U.K. Open an IBKR U.K. Account