


So far this week, we have been churning just above the 6,000 level for the S&P 500 (SPX). That’s relatively normal; round numbers often act as support and resistance levels. This seems like an opportune time to look at some secondary indicators that could provide some color about whether we are hitting a difficult wall or simply taking a breather. Quite frankly, while none of them offer a clear signal about the direction of the next move, they do offer some perspective about traders’ attitudes about risk going forward.
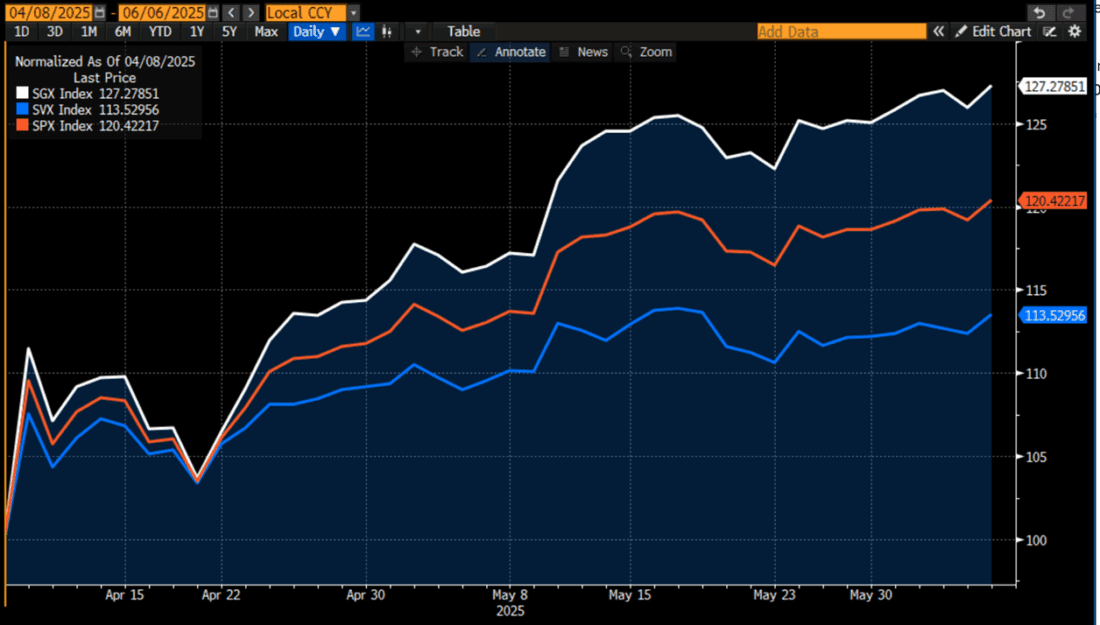
While it has been obvious that we are benefitting from a considerable focus on momentum, with a particular emphasis on growth stocks. The first chart makes the distinction apparent. Since the lows on April 8th, the S&P 500 Growth Index (SGX) has outperformed its Value counterpart (SVX) by more than twofold, with SGX up over 27.3% through Friday, more than double SVX’ 13.5% jump:
Daily Data Normalized to April 8th: SPX (orange), SGX (white), SVX (blue)
Source: Bloomberg
Past performance is not indicative of future results
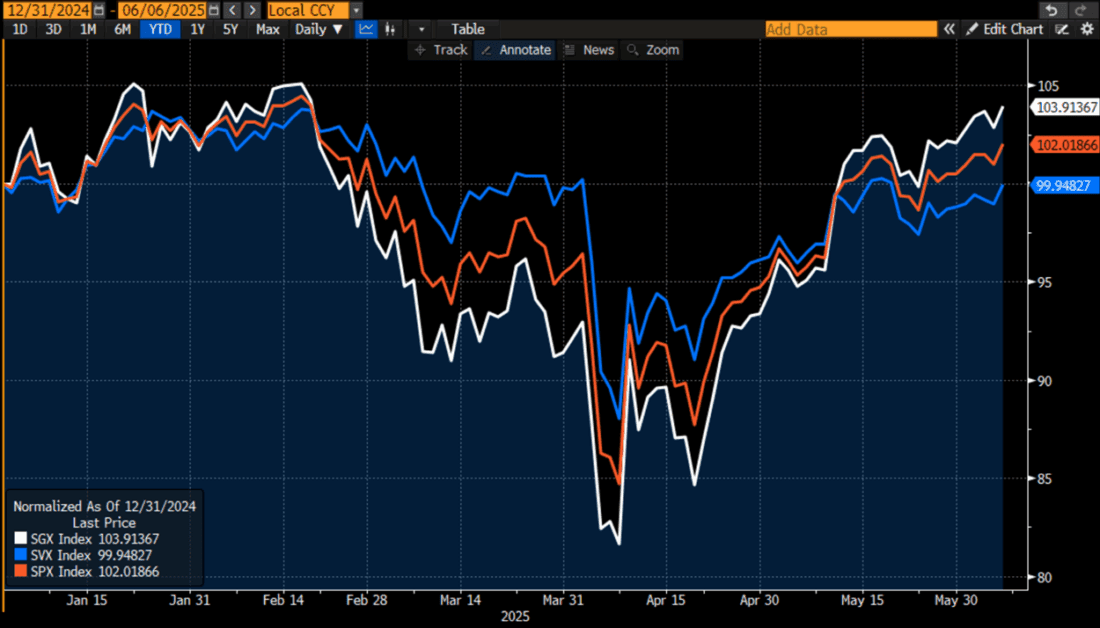
Interestingly, when we look at the same data on a year-to-date basis we see very little difference in overall performance, with SGX up 3.9% and SVX just about breakeven. Both compare reasonably well with the SPX 2% advance on the year through Friday:
Daily Data Normalized to December 31st: SPX (orange), SGX (white), SVX (blue)
Source: Bloomberg
Past performance is not indicative of future results
These charts are a classic reminder about risk and reward. The lesson here is that not only have growth stocks driven the market higher recently, but they also had a disproportionate effect in driving the market lower during the post “Liberation Day” chaos. Crowded trades that are driven by momentum outperform on the way up but also underperform substantially on the way down.
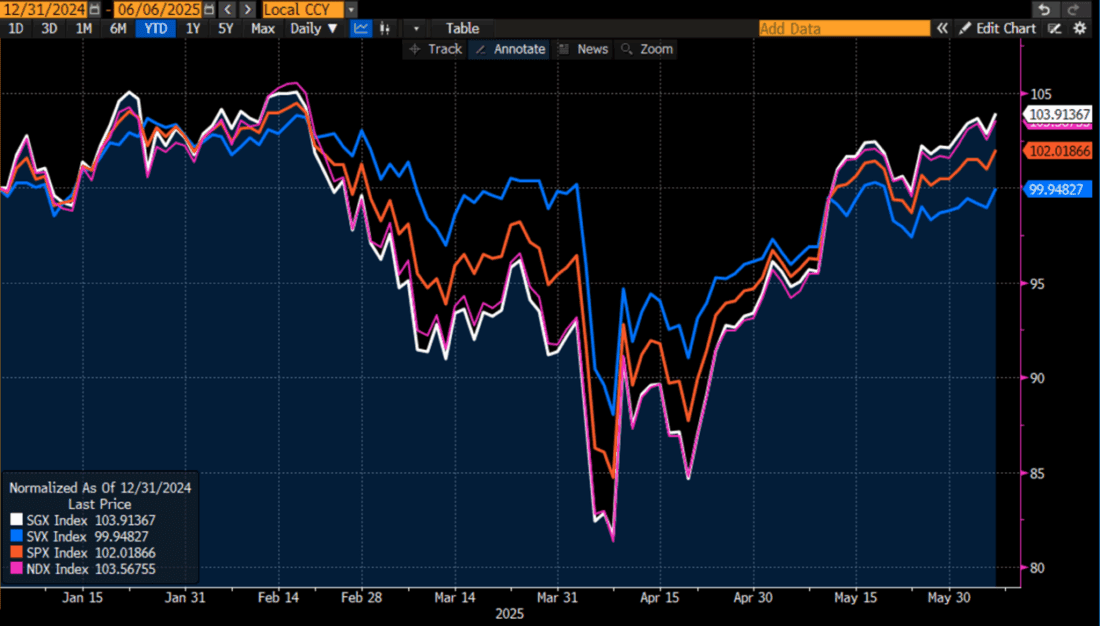
This has significant implications for hedgers. Our playbook of “don’t fight the tape, but insure against it” has been to refrain from getting in the way of the momentum freight train, but to be opportunistic about buying insurance against a pullback. The above graph shows that it likely behooves traders to more specifically hedge against a drop in the Nasdaq 100 (NDX) or another set of stocks that is (even) more heavily weighted with megacap tech stocks than SPX. Quite frankly, SGX and NDX move essentially in lockstep, as we see when we add NDX to the above graph:
Daily Data Normalized to December 31st: SPX (orange), SGX (white), SVX (blue), NDX (magenta)
Source: Bloomberg
Past performance is not indicative of future results
That said, it doesn’t appear as though many traders are particularly interested in hedging right now. The Cboe Volatility Index (VIX), which I view more as a gauge of institutional demand for hedging protection than a “fear gauge”, has been mired around the 17 level recently. That is more in line with its historical long-term average than the 15-ish levels that prevailed around SPX’s prior flirtations with the 6,000 level, but it has been falling steadily over the past few weeks since it’s tariff-related outburst:
1-Year Daily Data, SPX (blue, left scale), VIX (white, right scale), with horizontal line at SPX=6,000 and yellow lines at prior times SPX rose above 6,000

Source: Bloomberg
Past performance is not indicative of future results
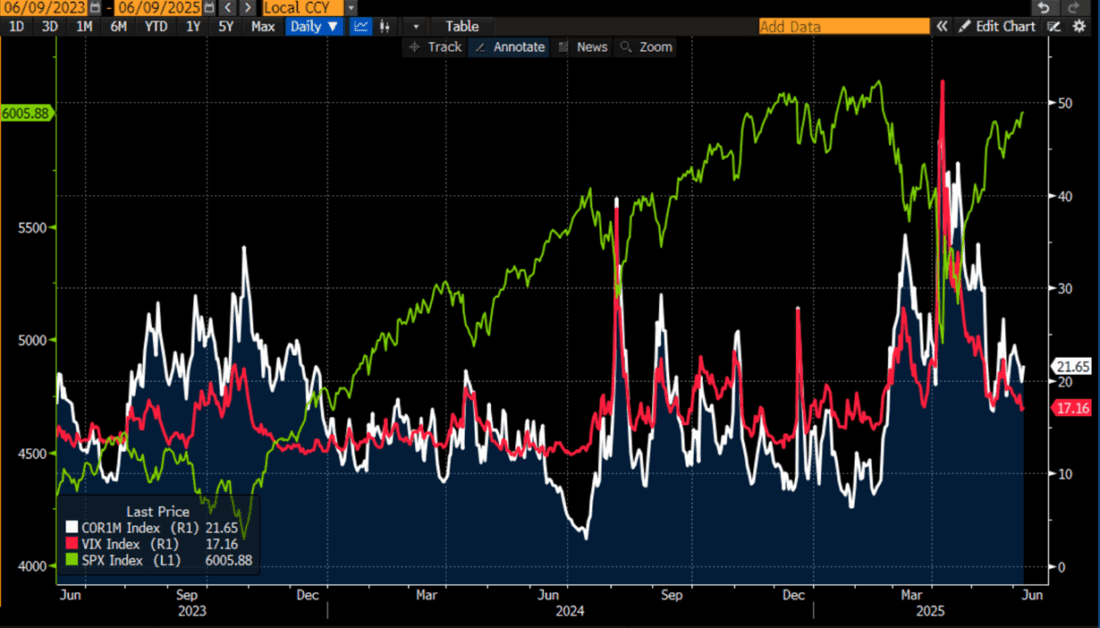
We have noted that correlation is a key factor affecting the volatility of an index, with higher correlations among index components leading to higher volatility for the index itself. Thus, it is useful to see if correlations are influencing the level of VIX now versus those prior occurrences. We can see from the chart below that correlation, as measured by the Cboe 1-month Implied Correlation Index (COR1M), is well above the levels that prevailed the last times that SPX saw 6,000. Therefore, it is neither unreasonable, nor a significant sign of less fear to see VIX quoted above those prior occurrences:
2-Years Daily Data, COR1M (white, right scale), VIX (red, right), SPX (green, left)
Source: Bloomberg
Past performance is not indicative of future results
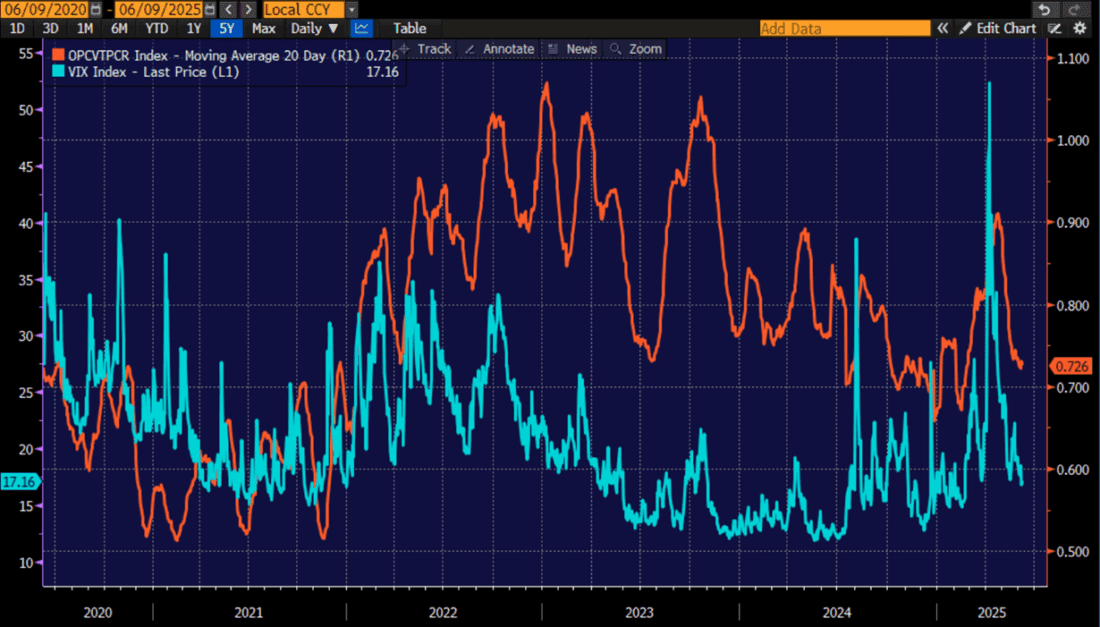
Finally, it is worth checking in with options activity to see if it is leaning disproportionately toward calls over puts. On an aggregate level it is, but it has become rather unusual for overall put volume to outweigh call volume. We see that the 20-day moving average of the Composite Put/Call ratio rarely rose above 1 in the past five years and has not done so in nearly two years. In any event, we see that ratio holding above the levels that prevailed in the period after the election and before the tariff announcements:
5-Years, Daily Data: 20-Day Moving Average of Composite Put/Call Ratio (orange, right scale), VIX (blue, left)
Source: Bloomberg
Past performance is not indicative of future results
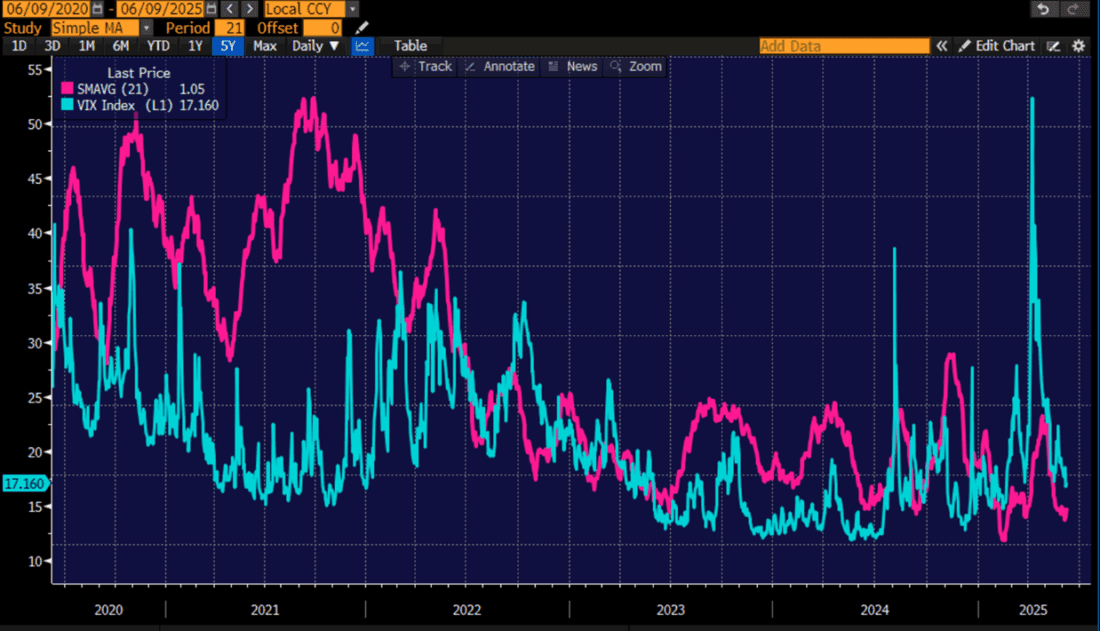
Interestingly, the following chart shows how the nature of the options market, and thus the Composite Put/Call ratio has changed. The following chart shows the 21-day moving average of the Index Put/Call ratio. Notice how it has settled into a newer, lower range since late 2022. It is hardly a coincidence that the trading of daily expirations on key indices, especially the cash-settled SPX variety, surged in popularity after Tuesday and Thursday expirations were added in 2022, and that the bull market since then has driven a strong preference for trading calls over puts on so-called 0DTE options. Quite frankly, that’s where much of the action in the options world is occurring.
5-Years, Daily Data: 21-Day Moving Average of Index Put/Call Ratio (magenta, right scale), VIX (blue, left)
Source: Bloomberg
Past performance is not indicative of future results
The takeways:
- Equity markets are sanguine, but not fully complacent.
- If you’re going to hedge, it’s likely better to hedge market exposure with NDX-linked, rather than SPX-linked products
- Traders love 0DTE calls!
New to Interactive Brokers?
Open AccountAlready an Interactive Brokers Client?
Request Trading PermissionDisclosure: Interactive Brokers
The analysis in this material is provided for information only and is not and should not be construed as an offer to sell or the solicitation of an offer to buy any security. To the extent that this material discusses general market activity, industry or sector trends or other broad-based economic or political conditions, it should not be construed as research or investment advice. To the extent that it includes references to specific securities, commodities, currencies, or other instruments, those references do not constitute a recommendation by IBKR to buy, sell or hold such investments. This material does not and is not intended to take into account the particular financial conditions, investment objectives or requirements of individual customers. Before acting on this material, you should consider whether it is suitable for your particular circumstances and, as necessary, seek professional advice.
The views and opinions expressed herein are those of the author and do not necessarily reflect the views of Interactive Brokers, its affiliates, or its employees.
Disclosure: ETFs
Any discussion or mention of an ETF is not to be construed as recommendation, promotion or solicitation. All investors should review and consider associated investment risks, charges and expenses of the investment company or fund prior to investing. Before acting on this material, you should consider whether it is suitable for your particular circumstances and, as necessary, seek professional advice.
Disclosure: Short Selling
Short selling is an advanced trading strategy involving potentially unlimited risks and must be done in a margin account.
Disclosure: Research
The availability of research providers may differ depending on your location. Much of the tools, information and services accessible through research tools are prepared and offered by independent third-party providers and not by Interactive Brokers. Information about a third-party provider provided on market research pages is NOT a recommendation of that provider by Interactive Brokers. Interactive Brokers does not make any representations or warranties concerning the services provided by the third-party providers.


Join The Conversation
If you have a general question, it may already be covered in our FAQs page. go to: IBKR Ireland FAQs or IBKR U.K. FAQs. If you have an account-specific question or concern, please reach out to Client Services: IBKR Ireland or IBKR U.K..
Visit IBKR U.K. Open an IBKR U.K. Account