








As usual, all eyes were glued to screens at 8:30 ET on the first Friday of a new month. That, of course, is the morning when the Bureau of Labor Statistics (BLS) releases its employment report for the prior month. Yesterday, we noted that options markets were pricing in an upside move with 1% volatility. That bout of socially acceptable volatility was the initial response. Bond traders initially loved the worse-than-expected report but then seemed to change their minds. Stock traders were slower to curb their enthusiasm. (Stick around for some key Q3 data.)
If you’re a job seeker, today’s report was impossible to sugarcoat. If you’re a bond investor who relishes economic weakness because it reduces pressure on inflation and biases central bankers towards accommodative policies, then you should have been okay with it.
There seemed to be plenty for the latter to like this morning. Nonfarm Payrolls rose by a mere 29,000 in September, well below the 90,000 consensus and last month’s 162,000. The latter figure was revised down to 133,000, which was part of a two-month downward revision of 60,000. The Unemployment Rate rose to 4.2% from 4.1% last month, when no increase was anticipated by economists. The key reason for that bump was a rise in the Labor Force Participation Rate (the denominator in the unemployment rate calculation) from 61.6% to 61.8%. It is quite possible that economic pressures are forcing people back into the workforce. If so, those new job seekers will not be pleased to discover that Average Hourly Earnings rose by a mere 0.1% in September, well below the prior reading and the consensus estimate of 0.3%.
Coming into the report, we saw pre-market index futures rallying even as 2-year and 10-year Treasury Note futures maintained yesterday’s gains of 10 and 4 basis points in the underlying notes, respectively. Lower oil prices and gains in European markets allowed US stocks to build upon the prior day’s modest upside. We can see from the chart below that ES (S&P 500), ZT (2-year), and ZN (10-year) futures all rose sharply after the report was released. But, as the morning progressed, while bonds steadily slipped towards negative territory, stock traders initially followed before deciding to push stocks higher again.
Intraday December Futures: ES (purple line), ZT (red/green 1-minute candles), ZN (blue line)

Source: Interactive Brokers (X-axis times in CDT), past performance is not indicative of future returns.
The move in bonds seems to be a matter of “buy the rumor, sell the news.” Rate hike expectations for October fell once again, dipping to 20% according to CME FedWatch. Meanwhile, risk-on moves are leading to all but three S&P 500 (SPX) sectors moving higher, with the outliers being the defensive financial, healthcare, and consumer staples sectors. In recent weeks, stock traders have seemed to relish taking positions home over a weekend. We’ll see if that enthusiasm remains into the session’s close.
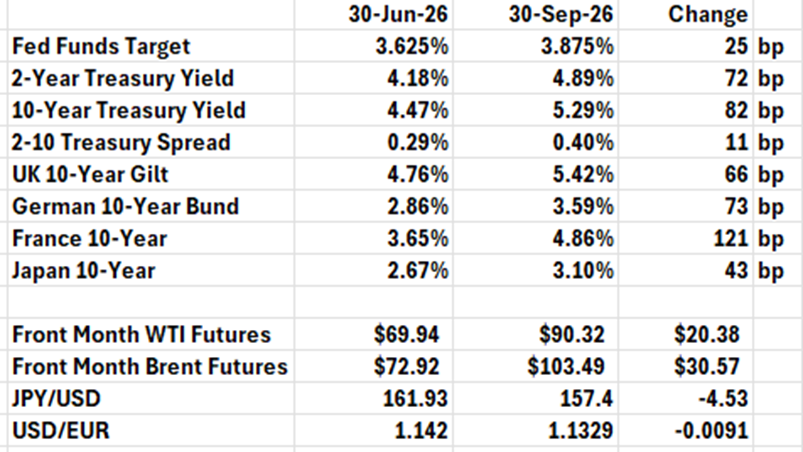
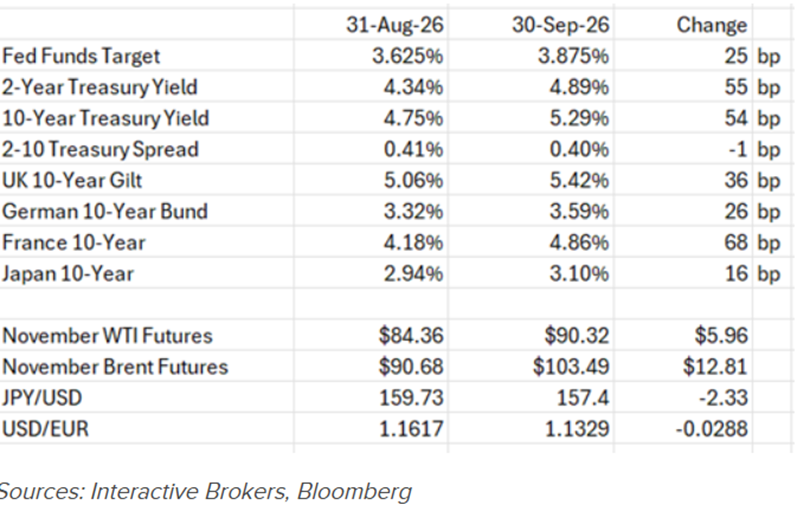
Meanwhile, it occurred to me after I published yesterday’s piece that I was so focused on the unusual month of September that I failed to compare the data to the recently ended third quarter. Let’s rectify that omission here. We can start with the table showing the moves in interest rates and oil prices. We can see that much of the quarter’s rise in global bond yields occurred in August while oil prices worsened more in the earlier part of the quarter.
Past performance is not indicative of future returns.
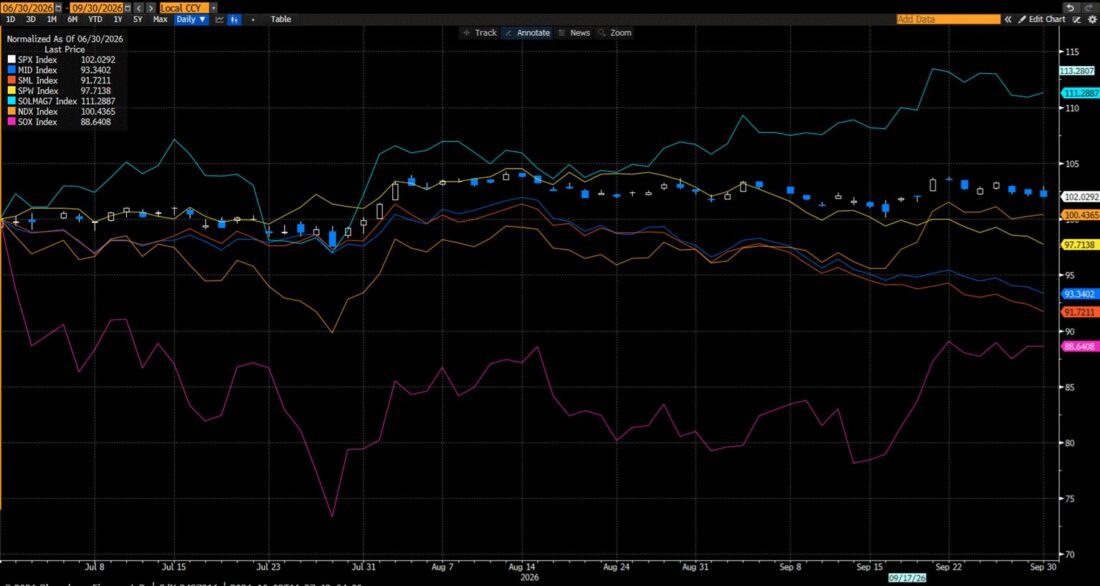
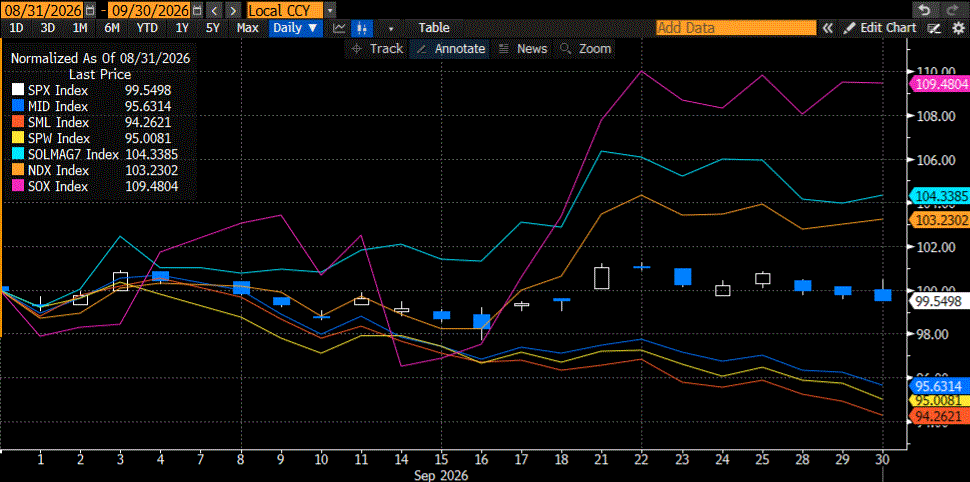
When we look at the equity market’s performance breakdown, we still see that large-cap indices heavily weighted with tech stocks showed outperformance on a quarterly basis, though there is a notable difference. In September, the performance was powered mainly by semiconductor stocks; however, in Q3 as a whole, the hyperscalers among the Magnificent 7 did most of the work.
Normalized Q3 Performances, SPX (candles), S&P Midcap 400 (dark blue), S&P 600 Small Cap (red), Equal-Weighted S&P 500 (yellow), Solactive Mag 7 Index (light blue), NDX (orange), SOX (magenta)
Source: Bloomberg, past performance is not indicative of future returns.
Normalized September Performances, SPX (candles), S&P Midcap 400 (dark blue), S&P 600 Small Cap (red), Equal-Weighted S&P 500 (yellow), Solactive Mag 7 Index (light blue), NDX (orange), SOX (magenta)
Source: Bloomberg, past performance is not indicative of future returns.
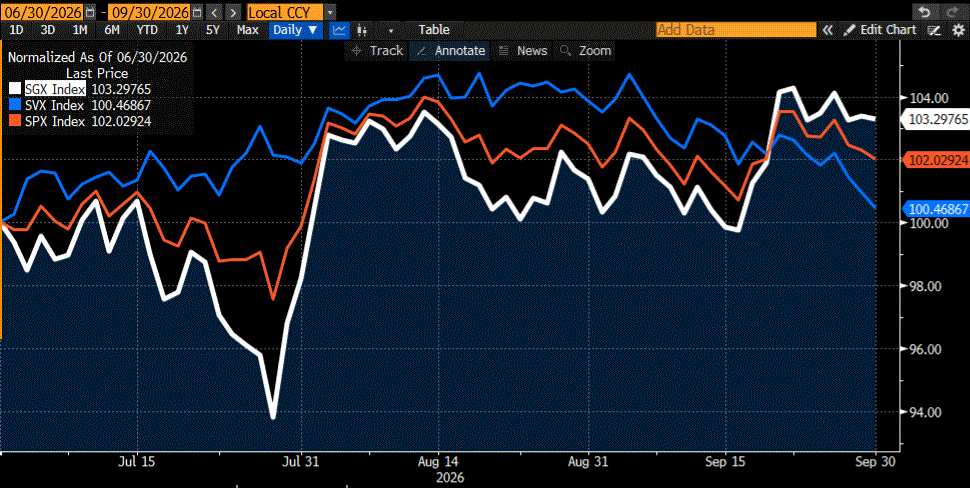
The breakdown between value and growth within SPX looks quite similar on a quarterly basis to the view in just September, though with a bit more upside.
Normalized Q3 Performances, SPX (red), SGX (white), SVX (blue)
Source: Bloomberg, past performance is not indicative of future returns.
Normalized September Performances, SPX (red), SGX (white), SVX (blue)

Source: Bloomberg, past performance is not indicative of future returns.
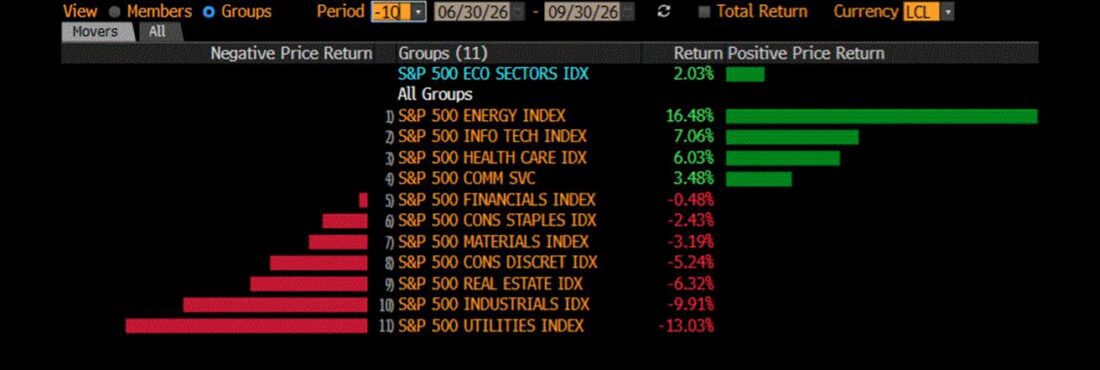
Finally, on a sectoral basis, tech was a key winner in Q3, as it was in September. But the $20 rise in oil prices understandably powered energy into first place. Healthcare also put in a solid performance when we view the quarter as a whole, though, like energy, it slipped to the downside in September.
Q3 S&P 500 Sectoral Performances
Source: Bloomberg, past performance is not indicative of future returns.
September S&P 500 Sectoral Performances
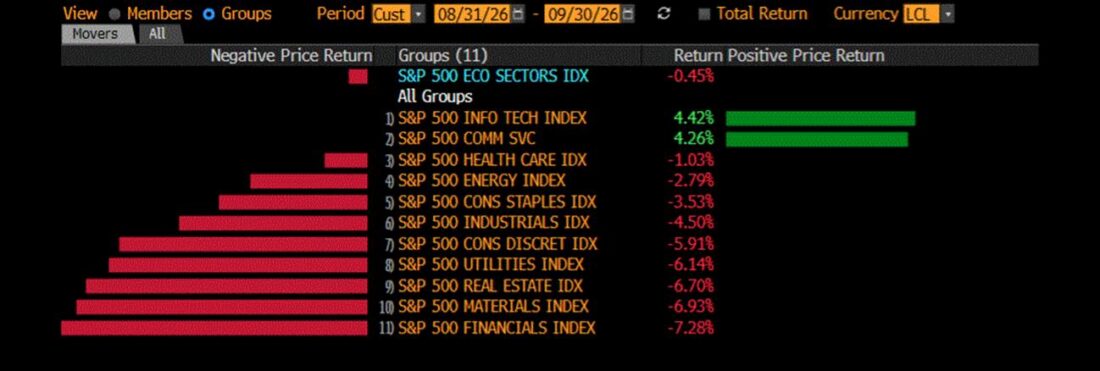
Source: Bloomberg, past performance is not indicative of future returns.
New to Interactive Brokers?
Open AccountAlready an Interactive Brokers Client?
Request Trading PermissionDisclosure: Interactive Brokers
The analysis in this material is provided for information only and is not and should not be construed as an offer to sell or the solicitation of an offer to buy any security. To the extent that this material discusses general market activity, industry or sector trends or other broad-based economic or political conditions, it should not be construed as research or investment advice. To the extent that it includes references to specific securities, commodities, currencies, or other instruments, those references do not constitute a recommendation by IBKR to buy, sell or hold such investments. This material does not and is not intended to take into account the particular financial conditions, investment objectives or requirements of individual customers. Before acting on this material, you should consider whether it is suitable for your particular circumstances and, as necessary, seek professional advice.
The views and opinions expressed herein are those of the author and do not necessarily reflect the views of Interactive Brokers, its affiliates, or its employees.
Disclosure: Futures Trading
Futures are not suitable for all investors. The amount you may lose may be greater than your initial investment. Before trading futures, please read the CFTC Risk Disclosure. A copy and additional information are available at the Warnings and Disclosures section of your local Interactive Brokers website.





Join The Conversation
If you have a general question, it may already be covered in our FAQs page. go to: IBKR Ireland FAQs or IBKR U.K. FAQs. If you have an account-specific question or concern, please reach out to Client Services: IBKR Ireland or IBKR U.K..
Visit IBKR U.K. Open an IBKR U.K. Account