








The now-ended third quarter was a weird one, to say the least. If I had told you in advance that interest rates would soar to levels that had not been in over 20 years, I doubt that you would have guessed that major US equity indexes would be unchanged to higher. As we noted recently, however, there are some unpleasant divergences lurking underneath that placid surface. Let’s dive into them and also take a look at market expectations for tomorrow’s employment report.
The big news for stock markets was, well, the bond market. Eyes were firmly focused on the likelihood of an FOMC rate hike – which indeed occurred on September 16th – but the action was located further out the yield curve. Both 2-year and 10-year Treasury yields rose by more than one-half percent to levels not seen since before the Global Financial Crisis. A generation of investors has never seen rates this high. The current level of rates would have seemed normal, if not relatively low, during the latter part of the prior century, but the level of indebtedness soared in the post-GFC period. Many of those debts – public and private – now need to be refinanced at significantly higher rates, leading to strains in government finances and areas like private credit.

Sources: Interactive Brokers, Bloomberg, past performance is not indicative of future returns.
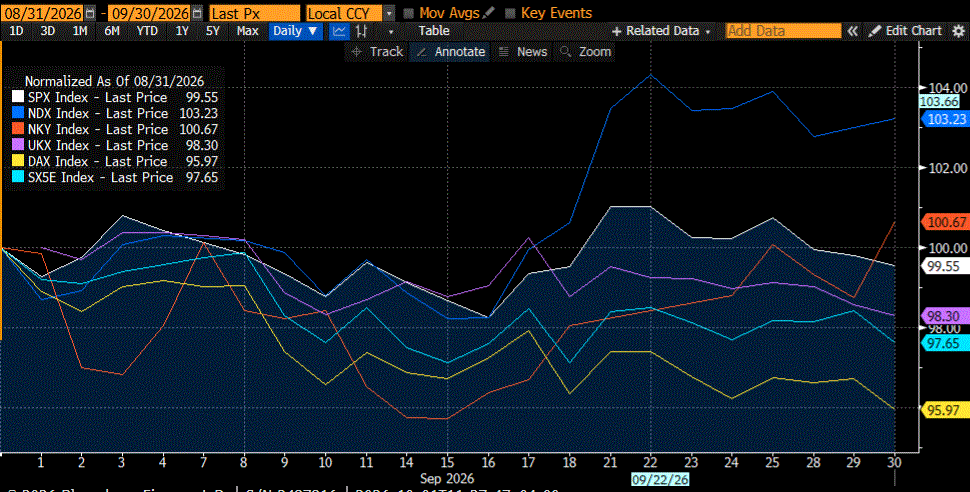
It is important to note, though, that the US was only part of a global trend toward higher rates. The table above includes 10-year rates in selected other major economies. The US is neither the best nor the worst in the table above. For the most part, we see similar performances from those countries’ key stock indexes.
Normalized September Performances, SPX (white), NDX (dark blue), Nikkei 225 (red), FTSE 100 (purple), DAX (yellow), Euro Stoxx 50 (light blue)
Source: Bloomberg, past performance is not indicative of future returns.
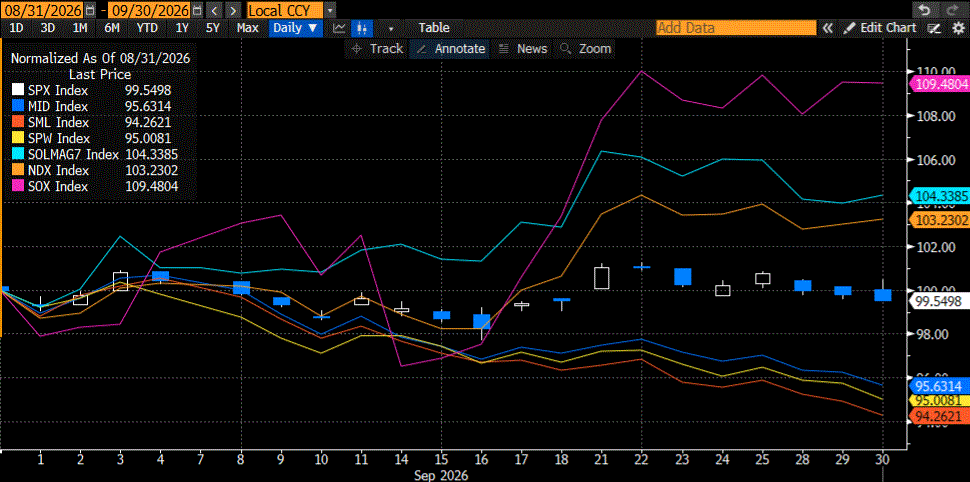
The demand for funds to enable the buildout of artificial intelligence capacity is undoubtedly raising the price of money – in other words, interest rates – but that sector has remained relatively unperturbed by rising rates. That money-hungry sector is far outshining the vast majority of other sectors of the US market. As we pointed out earlier this week, the outperformance of semiconductors and hyperscalers is stark when compared to the equal-weighted S&P 500 (SPX), Midcap, and Small Cap indices.
Normalized September Performances, SPX (candles), S&P Midcap 400 (dark blue), S&P 600 Small Cap (red), Equal-Weighted S&P 500 (yellow), Solactive Mag 7 Index (light blue), NDX (orange), SOX (magenta)
Source: Bloomberg, past performance is not indicative of future returns.
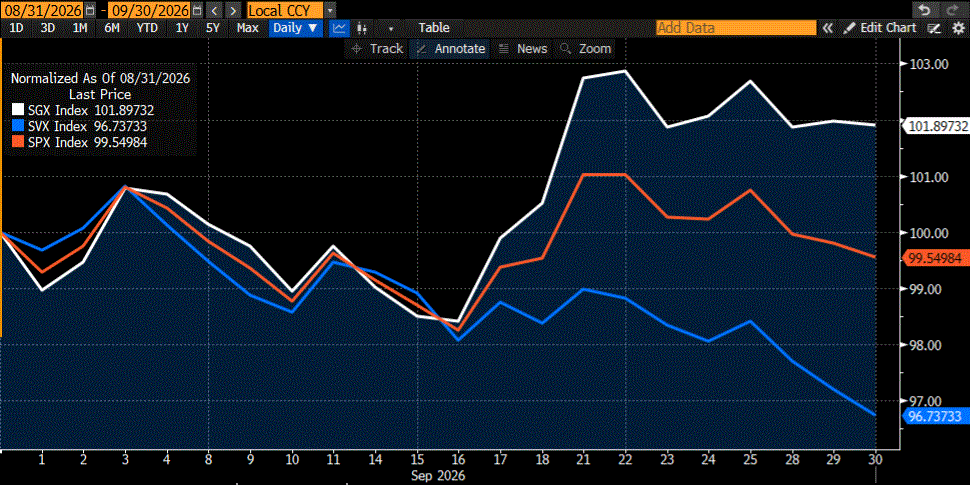
But it’s not just size that delineates the differing performances among various indices. When we compare the growth versus value components of SPX, we see a definite preference for growth. Although SGX, the S&P 500 Growth Index, outperformed SPX by more than SVX, its Value counterpart underperformed it. But remember that the total market capitalization of growth stocks is far larger than that of value stocks.
Normalized September Performances, SPX (red), SGX (white), SVX (blue)
Source: Bloomberg, past performance is not indicative of future returns.
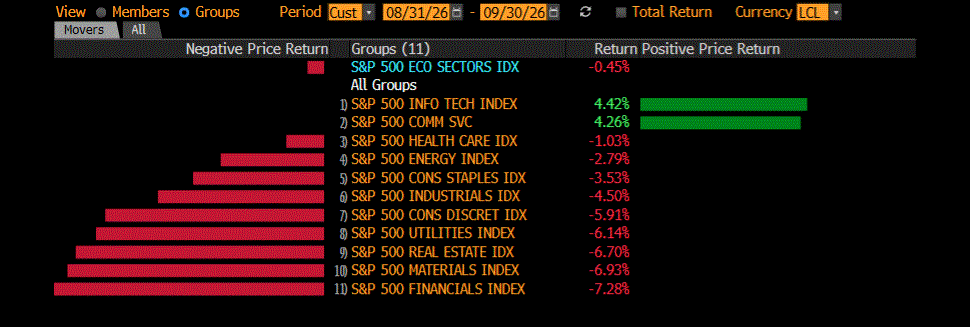
The differentiation is even more stark when we look at September’s performance on a sectoral basis. It’s basically technology and communications (which includes Alphabet (GOOG, GOOGL) and Meta Platforms (META), among other stocks commonly considered to be tech) up, and everything else – including energy, in a month when oil prices rose – down.
September S&P 500 Sectoral Performances
Source: Bloomberg, past performance is not indicative of future returns.
Although we see stocks meandering at lower levels this morning, bonds are not the culprit today. The 2-year yield is 10 basis points lower, while the 10-year yield is down by 5 basis points despite a significant jump in ISM Prices Paid. Our conclusion yesterday aged pretty well today:
We often think of equity investors being driven by momentum and the desire for window dressing around reporting periods, but so are bond investors. They’re human too, just maybe a bit more pessimistic than their stock market counterparts. If that is the case, we could see an oversold bounce when the calendar turns tomorrow, but that will require some assistance from Friday’s employment report.
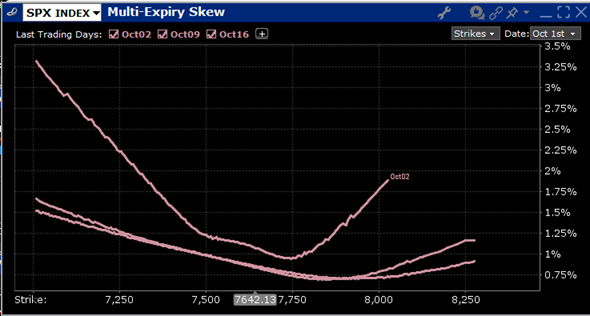
Speaking of that August employment report, options traders are pricing in a bit more volatility than usual, but not especially so. For SPX options expiring tomorrow, we see the usual slight upside bias to the peak probability and an at-money daily volatility of just over 1%. Combined with the relatively steep skews that we see in those near-term options, it seems fair to say that traders are wary, but not especially nervous.
IBKR Probability Lab for SPX Options Expiring October 2nd, 2026

Source: Interactive Brokers, past performance is not indicative of future returns.
Skews for SPX Options Expiring October 2nd (top), 9th (middle), 16th (bottom)
Sources: Interactive Brokers, past performance is not indicative of future returns.
New to Interactive Brokers?
Open AccountAlready an Interactive Brokers Client?
Request Trading PermissionDisclosure: Interactive Brokers
The analysis in this material is provided for information only and is not and should not be construed as an offer to sell or the solicitation of an offer to buy any security. To the extent that this material discusses general market activity, industry or sector trends or other broad-based economic or political conditions, it should not be construed as research or investment advice. To the extent that it includes references to specific securities, commodities, currencies, or other instruments, those references do not constitute a recommendation by IBKR to buy, sell or hold such investments. This material does not and is not intended to take into account the particular financial conditions, investment objectives or requirements of individual customers. Before acting on this material, you should consider whether it is suitable for your particular circumstances and, as necessary, seek professional advice.
The views and opinions expressed herein are those of the author and do not necessarily reflect the views of Interactive Brokers, its affiliates, or its employees.
Disclosure: Options (with multiple legs)
Options involve risk and are not suitable for all investors. For information on the uses and risks of options read the "Characteristics and Risks of Standardized Options" also known as the options disclosure document (ODD). Multiple leg strategies, including spreads, will incur multiple transaction costs.
Disclosure: Futures Trading
Futures are not suitable for all investors. The amount you may lose may be greater than your initial investment. Before trading futures, please read the CFTC Risk Disclosure. A copy and additional information are available at the Warnings and Disclosures section of your local Interactive Brokers website.
Disclosure: Probability Lab
The projections or other information generated by the Probability Lab tool regarding the likelihood of various investment outcomes are hypothetical in nature, do not reflect actual investment results and are not guarantees of future results. Please note that results may vary with use of the tool over time.





Join The Conversation
If you have a general question, it may already be covered in our FAQs page. go to: IBKR Ireland FAQs or IBKR U.K. FAQs. If you have an account-specific question or concern, please reach out to Client Services: IBKR Ireland or IBKR U.K..
Visit IBKR U.K. Open an IBKR U.K. Account