


1/ Strong Breadth & Equal Weight
2/ Discretionary vs. Staples
3/ Growth vs. Value
Investopedia is partnering with CMT Association on this newsletter. The contents of this newsletter are for informational and educational purposes only, however, and do not constitute investing advice. The guest authors, which may sell research to investors, and may trade or hold positions in securities mentioned herein do not represent the views of CMT Association or Investopedia. Please consult a financial advisor for investment recommendations and services.
1/
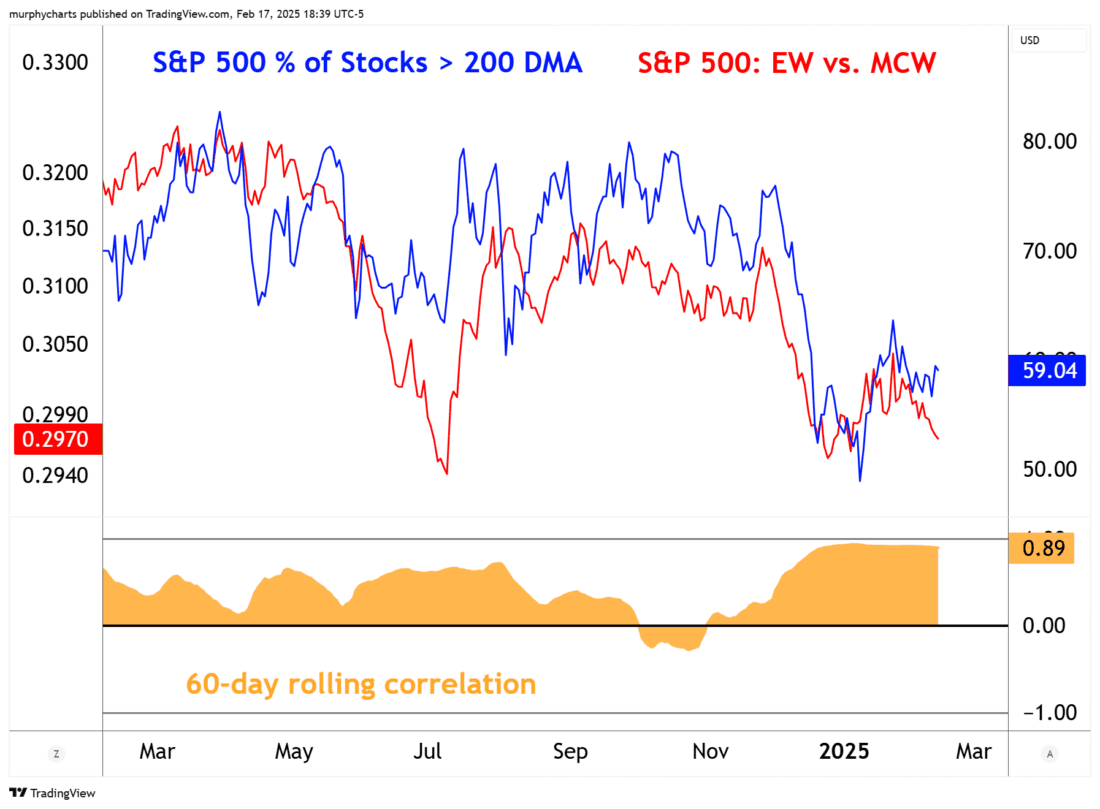
Strong Breadth & Equal Weight
Moving average breadth is improving and recovering off the lows to start the year. 59% of S&P 500 companies are now trading above the 200-day average. This breadth indicator strongly correlates to the ratio of S&P 500 Equal-weight vs. S&P 500 Market-cap Weight.
Past performance is not indicative of future results
If breadth is improving and more stocks are in healthy uptrends, one could assume equal-weight is outperforming market-cap weight. Historically, some of the strongest spurts of equal-weight outperformance followed an expansion of moving average breadth. Something to keep an eye on in 2025!
2/
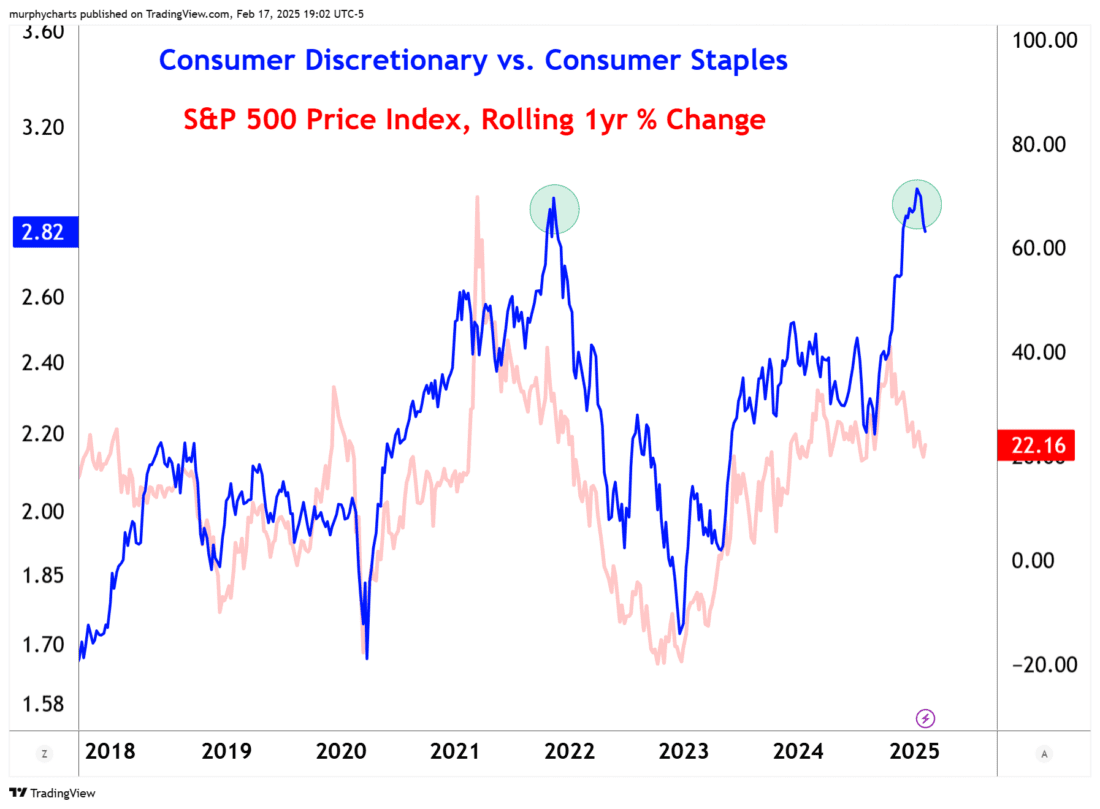
Discretionary vs. Staples
One of my favorite gauges of investor risk appetite is the price ratio of Consumer Discretionary to Consumer Staples stocks. Typically, new highs are meant to signal increased risk appetite among investors i.e. investors are bidding up cyclical stocks and selling defensive stocks. However, the ratio is trading +3 standard deviations above the 3yr average. In recent years, this level has signaled muted forward 12-month price returns.
Past performance is not indicative of future results
3/
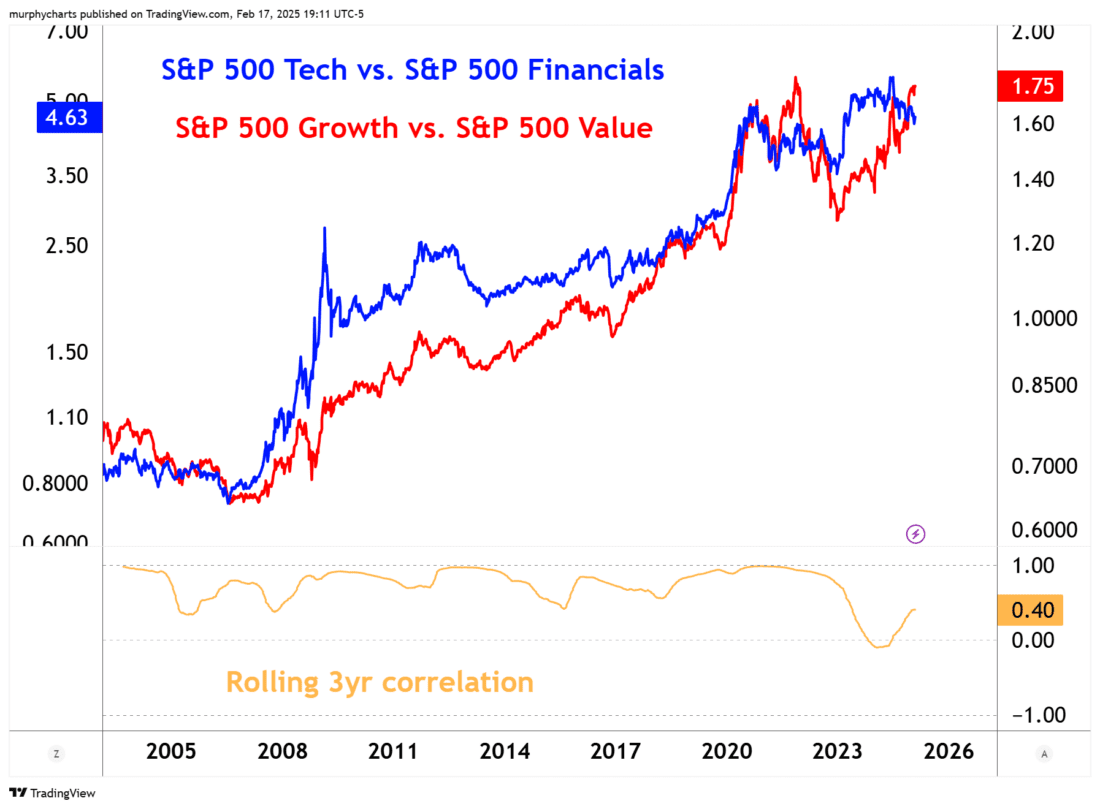
Growth vs. Value
The definitions of growth and value equity haven’t changed, but the constituents that make up various growth and value indices certainly have. The below chart displays two price ratios. The first compares S&P 500 Growth Index to the S&P 500 Value index (red line). The second compares the S&P 500 Technology sector to the S&P 500 Financials sector (blue line). Historically, the ratios held a very strong positive correlation. For obvious reasons, Financials tend to be more represented in the Value Index and Technology more so in the Growth Index.
Past performance is not indicative of future results
The story here is in the decoupling of the ratios. The rolling 3-year correlation reached negative territory in 2024. The reason is in part due to the growth of the Technology sector. Just 5-years ago in February 2020, the Technology sector represented 8.6% of the S&P 500 Value Index. Today, Technology is the largest weighted sector at 24%, surpassing even Financials (#2 weighted sector, 15.6%). The top 3 weighted companies in this Value index are Apple, Microsoft, and Amazon. Yes, you read that correctly. My point being, is that not every Large-cap Value Index is built the same. Know what you own and why you own it!
—
Originally posted 18th February 2025
Disclosure: Investopedia
Investopedia.com: The comments, opinions and analyses expressed herein are for informational purposes only and should not be considered individual investment advice or recommendations to invest in any security or to adopt any investment strategy. While we believe the information provided herein is reliable, we do not warrant its accuracy or completeness. The views and strategies described on our content may not be suitable for all investors. Because market and economic conditions are subject to rapid change, all comments, opinions and analyses contained within our content are rendered as of the date of the posting and may change without notice. The material is not intended as a complete analysis of every material fact regarding any country, region, market, industry, investment or strategy. This information is intended for US residents only.
Disclosure: Interactive Brokers Third Party
Information posted on IBKR Campus that is provided by third-parties does NOT constitute a recommendation that you should contract for the services of that third party. Third-party participants who contribute to IBKR Campus are independent of Interactive Brokers and Interactive Brokers does not make any representations or warranties concerning the services offered, their past or future performance, or the accuracy of the information provided by the third party. Past performance is no guarantee of future results.
This material is from Investopedia and is being posted with its permission. The views expressed in this material are solely those of the author and/or Investopedia and Interactive Brokers is not endorsing or recommending any investment or trading discussed in the material. This material is not and should not be construed as an offer to buy or sell any security. It should not be construed as research or investment advice or a recommendation to buy, sell or hold any security or commodity. This material does not and is not intended to take into account the particular financial conditions, investment objectives or requirements of individual customers. Before acting on this material, you should consider whether it is suitable for your particular circumstances and, as necessary, seek professional advice.
Disclosure: ETFs
Any discussion or mention of an ETF is not to be construed as recommendation, promotion or solicitation. All investors should review and consider associated investment risks, charges and expenses of the investment company or fund prior to investing. Before acting on this material, you should consider whether it is suitable for your particular circumstances and, as necessary, seek professional advice.
Disclosure: Futures Trading
Futures are not suitable for all investors. The amount you may lose may be greater than your initial investment. Before trading futures, please read the CFTC Risk Disclosure. A copy and additional information are available at the Warnings and Disclosures section of your local Interactive Brokers website.
Disclosure: Bonds
As with all investments, your capital is at risk.
Disclosure: Options Trading
Options involve risk and are not suitable for all investors. For information on the uses and risks of options read the "Characteristics and Risks of Standardized Options" also known as the options disclosure document (ODD). Multiple leg strategies, including spreads, will incur multiple transaction costs.


Join The Conversation
If you have a general question, it may already be covered in our FAQs page. go to: IBKR Ireland FAQs or IBKR U.K. FAQs. If you have an account-specific question or concern, please reach out to Client Services: IBKR Ireland or IBKR U.K..
Visit IBKR U.K. Open an IBKR U.K. Account