


Breadth Indicators as Market Guides: What They Tell Us About Future Trends
Investopedia is partnering with CMT Association on this newsletter. The contents of this newsletter are for informational and educational purposes only, however, and do not constitute investing advice. The guest authors, which may sell research to investors, and may trade or hold positions in securities mentioned herein do not represent the views of CMT Association or Investopedia. Please consult a financial advisor for investment recommendations and services.
Breadth Indicators as Market Guides: What They Tell Us About Future Trends
After the market took a promising turn from its mid-April lows, many of us are keenly watching to see if this upward trend has legs. Today, we’ll explore a few vital market breadth indicators that can help us determine the strength and potential longevity of this bullish phase.
Before diving into those indicators, let’s touch on the holistic approach we use here. Apart from the usual chart analysis, understanding economic indicators like Federal Reserve policies, inflation, and interest rates also plays a critical role in our assessments. Additionally, combining these insights with robust quantitative models gives us a clearer picture of potential movements.

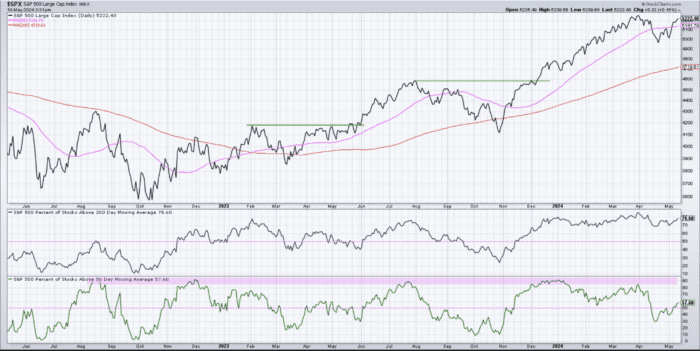
Courtesy of StockCharts.com
Past performance is not indicative of future results
Now, onto the essential indicators that could signal whether we’re in for a sustained bull market:
Percentage of Stocks Above Moving Averages
This is one of the clearest indicators of market health. A considerable number of S&P 500 stocks are currently thriving above their 50-day and 200-day moving averages. This widespread positivity often suggests a strong and supportive market environment.
Daily Difference in New 52-week Highs and Lows
Focusing on market leadership, this indicator tracks the number of stocks reaching new highs versus those hitting new lows. Recently, we’ve seen more stocks scaling new highs, an encouraging sign that leadership within the market is robust and potentially driving the indices toward record levels.
Bullish Percent Index for Nasdaq 100
This index zeroes in on significant tech and growth stocks, measuring how many are currently showing bullish trends on their point and figure charts. As it hovers around 50%, a push past this threshold could indicate a powerful momentum build-up among these influential stocks.
These indicators serve as critical tools for both confirming the current market rally and helping us strategize our next moves. If these metrics continue to show strength, it’s likely that the bullish trend is here to stay. However, any signs of their weakening could suggest the rally might be running out of steam and require us to reconsider our positions.
Let’s keep a close watch on these indicators and discuss their possible implications. What’s your take on the current market trends? Do you feel optimistic about the sustaining power of this rally, or do you foresee a downturn? Keep analyzing, keep questioning, and as always, invest wisely.
—–
Originally posted on May 20th, 2024
Disclosure: Investopedia
Investopedia.com: The comments, opinions and analyses expressed herein are for informational purposes only and should not be considered individual investment advice or recommendations to invest in any security or to adopt any investment strategy. While we believe the information provided herein is reliable, we do not warrant its accuracy or completeness. The views and strategies described on our content may not be suitable for all investors. Because market and economic conditions are subject to rapid change, all comments, opinions and analyses contained within our content are rendered as of the date of the posting and may change without notice. The material is not intended as a complete analysis of every material fact regarding any country, region, market, industry, investment or strategy. This information is intended for US residents only.
Disclosure: Interactive Brokers Third Party
Information posted on IBKR Campus that is provided by third-parties does NOT constitute a recommendation that you should contract for the services of that third party. Third-party participants who contribute to IBKR Campus are independent of Interactive Brokers and Interactive Brokers does not make any representations or warranties concerning the services offered, their past or future performance, or the accuracy of the information provided by the third party. Past performance is no guarantee of future results.
This material is from Investopedia and is being posted with its permission. The views expressed in this material are solely those of the author and/or Investopedia and Interactive Brokers is not endorsing or recommending any investment or trading discussed in the material. This material is not and should not be construed as an offer to buy or sell any security. It should not be construed as research or investment advice or a recommendation to buy, sell or hold any security or commodity. This material does not and is not intended to take into account the particular financial conditions, investment objectives or requirements of individual customers. Before acting on this material, you should consider whether it is suitable for your particular circumstances and, as necessary, seek professional advice.


")
Join The Conversation
If you have a general question, it may already be covered in our FAQs page. go to: IBKR Ireland FAQs or IBKR U.K. FAQs. If you have an account-specific question or concern, please reach out to Client Services: IBKR Ireland or IBKR U.K..
Visit IBKR U.K. Open an IBKR U.K. Account