


Originally Posted 7 November 2025 – Look beyond Silicon Valley: International markets gain from US concentration concerns
Authors: Ben Lofthouse, CFA and Callum Rushforth, CFA
Investors concerned about potential trade tariff impacts, stretched valuations, overexposure as well as high concentration in US stocks should look elsewhere to achieve better portfolio diversification, according to Head of Global Equity Income, Ben Lofthouse and Associate Client Portfolio Manager, Callum Rushforth.

Key takeaways:
- The dominance of technology and AI-driven stocks in the US market has reached unprecedented levels, with the top ten stocks representing over 40% of the S&P 500’s market capitalisation.
- If sentiment changes, the overexposure and the sheer size of concentration in US stocks means any outflows into international markets can lead to significant swings in share prices and markets, as we saw this year into sectors such as utilities, industrials and financials.
- A global approach to equity investing offers multiple advantages, such as the opportunity to benefit from regional catalysts and sector diversification, plus better risk-adjusted returns.
Global investors have long favoured US equities, attracted by their growth prospects, liquidity, and the dominance of its technology sector. So much so, that the top ten US stocks constitute almost 40.2% of the total market capitalisation of the S&P 500. Even before the dot-com bubble burst, tech stocks were less than 35% of US market capitalisation.
Are tech stocks the new railroad barons?
This level of concentration is unprecedented. While it falls short of the 1881 US railroad dominance, which accounted for 63% of the US market back then, the railroad sector was not composed of just ten companies. The railroad boom was driven by extraordinary optimism, with investors believing it would be a strong catalyst for economic growth, and a key driver of the Second Industrial Revolution — not too dissimilar from enthusiasm for everything AI today.
Of today’s top ten stocks, seven are technology / AI-related.
Figure 1: US market concentration is high relative to history
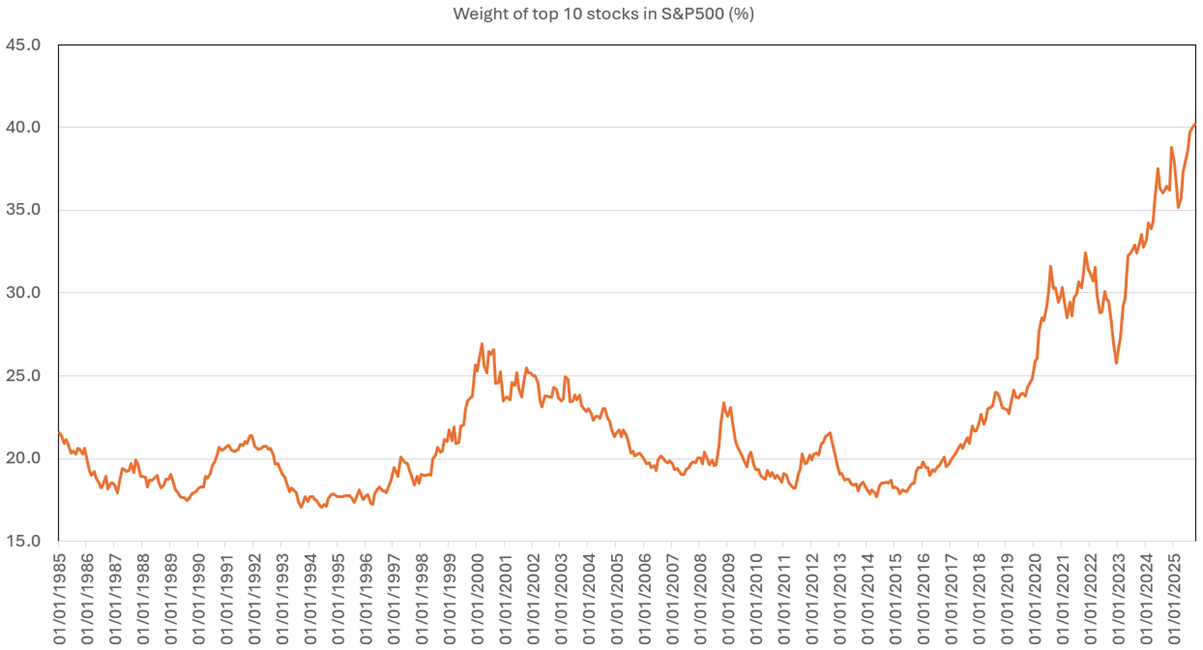
Source: Goldman Sachs Global Investment Research, S&P Global, Compustat, CRSP as at 31 October 2025.
Past performance does not predict future growth.
The top ten S&P 500 stocks collectively represent more than US$24.5 trillion– close to half of the US market’s capitalisation. To put it in further perspective, this sum rivals the current combined market capitalisations of Japan, Canada, the UK, Germany, France, Switzerland, the Netherlands and Australia.
Figure 2: Top 10 stocks in S&P500 larger than eight markets combined
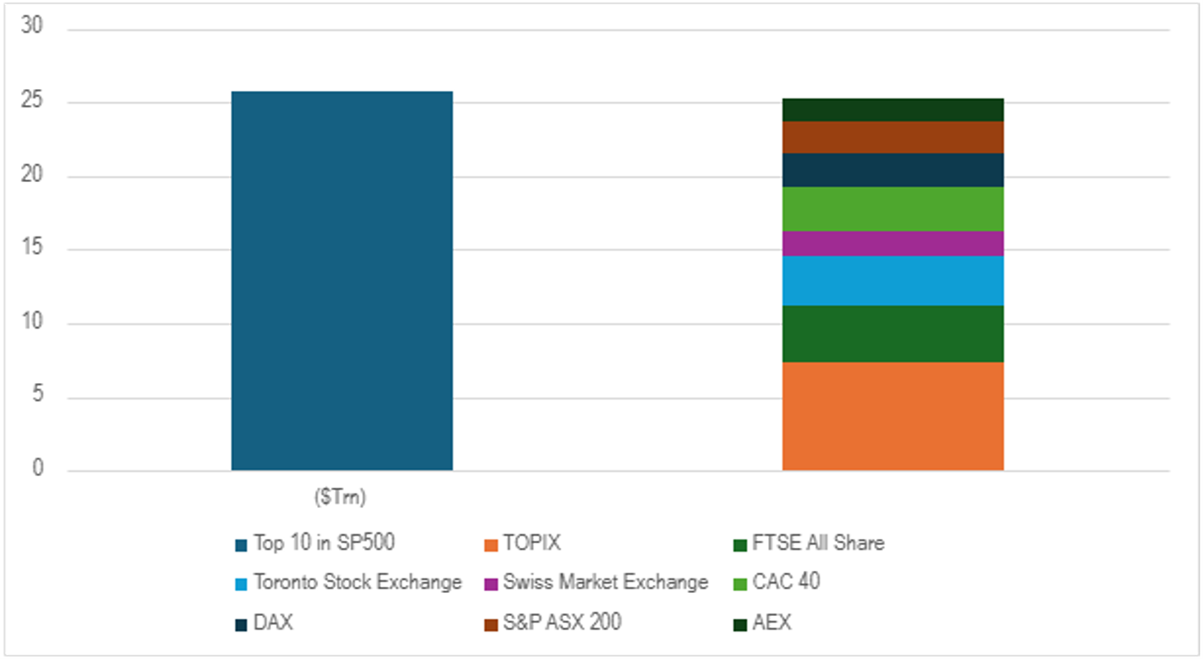
Source: Bloomberg, Janus Henderson analysis as at 31 October 2025
Past performance does not predict future growth.
While not to shy away from the clear benefits AI could bring, this concentration raises questions about overexposure to a small group of stocks, geopolitics, and the risk that sentiment shifts if the impact of AI undershoots investors’ lofty expectations.
What are the implications of US outflows?
- Small change to allocations can have large impacts: Since the beginning of 2025, driven by geopolitics, trade tariffs, overvaluation in the tech sector and concerns around AI capital spending, there has been a significant shift in investor sentiment towards US equities. Investors have broadened out their allocations into regions such as Europe and Asia. But given the vast amount of capital in the US market, even modest reallocations to other regions can cause dramatic movements in share prices and markets.
- Market leadership can change: There has been trend of growth outperforming value stocks for over a decade, leading to a narrative that “value isn’t working” however we are seeing a different story starting to emerge. Post a period of style rotation in 2022, as inflation and interest rate expectations rose, the US quickly reverted to its growth bias, led by large cap technology stocks, however international markets sustained their value tilt. Since 2024, value has been outperforming growth.
Figure 3: Growth sector outperformance in the US; Value outperformance elsewhere
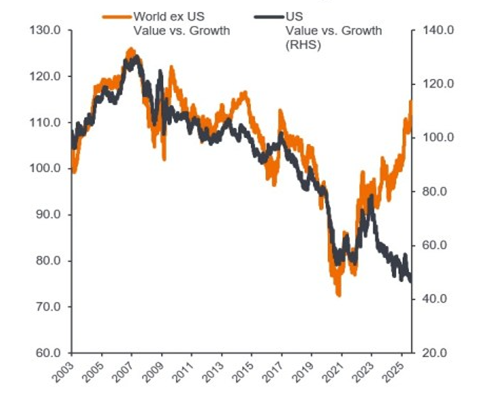
Source: Goldman Sachs Investment Research, Bloomberg, Janus Henderson Investors as at 31 August 2025. LHS chart total return indexed to 100 as at Jan 2003. Past performance does not predict future growth.
Figure 3 supports this observation. Based on MSCI sector data, it illustrates how sector performance has diversified as investors have shifted their regional allocations.
In the MSCI World Index, technology accounts for 26%, but in the MSCI World ex US, technology represents just 8%.
As investors diversify, international markets—characterised by broader sector representation have benefited this year, with a more diverse group of sectors performing well. Due to the lower market capitalisation of these markets, large inflows into these value pockets can lead to significant share price reactions. The financial, industrials and utilities sectors in 2025 serve as examples of this trend.
Figure 4: Diversified sector performance amid investors’ shift in regional allocations
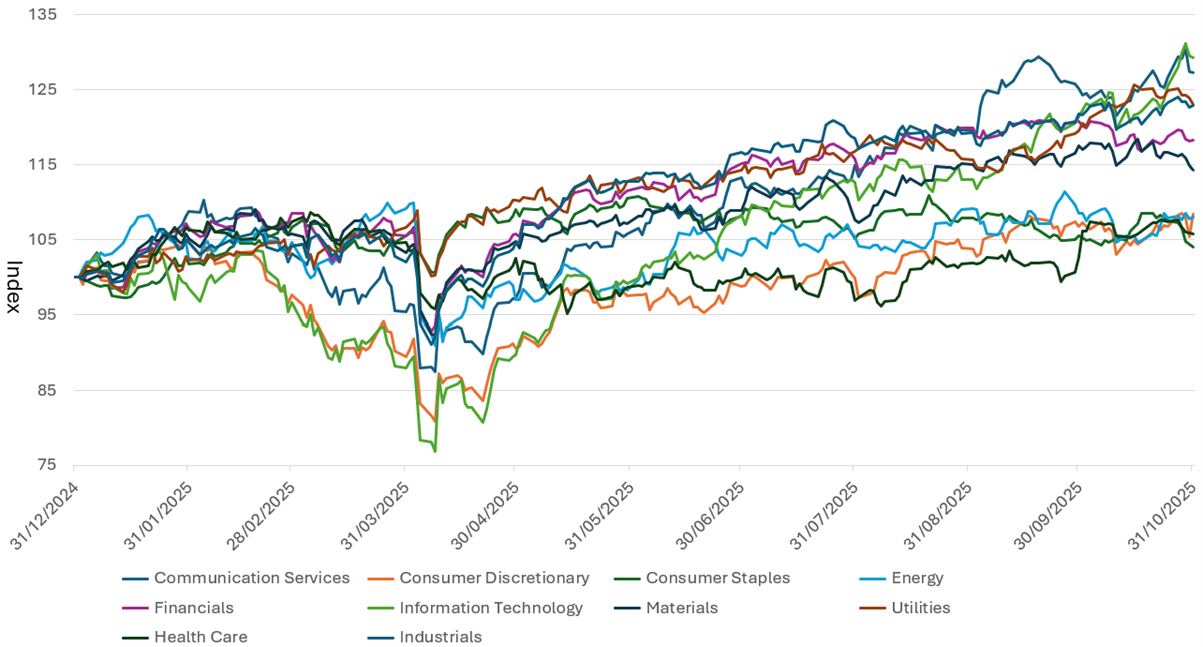
Source: Bloomberg, Janus Henderson Investors, data showing the absolute performance of sectors within the MSCI World. Period covering 31 December 2024 to 31 October 2025. Past performance does not predict future growth.
It is not all just about flows though. There are also positive catalysts that could further drive share prices in international markets. For example, if Europe can address key challenges such as fiscal policies and continues its deregulation activities, additional capital is likely to flow into the region and further support share prices.
Conclusion
The current dominance of the top ten US technology stocks bears a striking resemblance to the railroad companies of 1881. Both periods are marked by a significant concentration of market power within a single sector.
In contrast, international markets offer investors the opportunity to diversify their portfolios at more reasonable valuations and greater sector diversity. A modest shift away from concentrated US stocks could yield strong performance and broaden market leadership. Further, global equity investing should not be seen as a zero-sum game; the asymmetry in market sizes and valuations means that significant gains in one region do not require major losses in another. For instance, the FTSE All-Share trades at 13.7x earnings, the Euro Stoxx 600 at 15.5x, the TOPIX at 16x, compared to the S&P 500 at 24.5x currently.
While it’s impossible to predict exactly when market shifts will occur, maintaining exposure to a diverse international portfolio ensures you’re positioned to benefit when they do. For those investors who worry that they are overexposed to a handful of large, highly correlated stocks, investing in international markets is a prudent approach as it facilitates portfolio diversification from a regional, sector and stock level, provides opportunities to benefit from regional catalysts, and most importantly, increase the potential for better risk-adjusted returns.
Disclosure: Janus Henderson
The opinions and views expressed are as of the date published and are subject to change without notice. They are for information purposes only and should not be used or construed as an offer to sell, a solicitation of an offer to buy, or a recommendation to buy, sell or hold any security, investment strategy or market sector. No forecasts can be guaranteed. Opinions and examples are meant as an illustration of broader themes and are not an indication of trading intent. It is not intended to indicate or imply that any illustration/example mentioned is now or was ever held in any portfolio. Janus Henderson Group plc through its subsidiaries may manage investment products with a financial interest in securities mentioned herein and any comments should not be construed as a reflection on the past or future profitability. There is no guarantee that the information supplied is accurate, complete, or timely, nor are there any warranties with regards to the results obtained from its use. Past performance is no guarantee of future results. Investing involves risk, including the possible loss of principal and fluctuation of value.
Disclosure: Interactive Brokers Third Party
Information posted on IBKR Campus that is provided by third-parties does NOT constitute a recommendation that you should contract for the services of that third party. Third-party participants who contribute to IBKR Campus are independent of Interactive Brokers and Interactive Brokers does not make any representations or warranties concerning the services offered, their past or future performance, or the accuracy of the information provided by the third party. Past performance is no guarantee of future results.
This material is from Janus Henderson and is being posted with its permission. The views expressed in this material are solely those of the author and/or Janus Henderson and Interactive Brokers is not endorsing or recommending any investment or trading discussed in the material. This material is not and should not be construed as an offer to buy or sell any security. It should not be construed as research or investment advice or a recommendation to buy, sell or hold any security or commodity. This material does not and is not intended to take into account the particular financial conditions, investment objectives or requirements of individual customers. Before acting on this material, you should consider whether it is suitable for your particular circumstances and, as necessary, seek professional advice.


")
Join The Conversation
If you have a general question, it may already be covered in our FAQs page. go to: IBKR Ireland FAQs or IBKR U.K. FAQs. If you have an account-specific question or concern, please reach out to Client Services: IBKR Ireland or IBKR U.K..
Visit IBKR U.K. Open an IBKR U.K. Account