


Originally posted 7 October 2025 – Credit Futures: What Clients Are Saying
Explore the liquidity, bid/offer spreads and recent market activity of Credit futures, including insights and product performance during volatile periods.
What is the typical bid/offer spread?
The average bid/offer spreads are shown in the table below, initially represented in index points, which is how the futures are quoted. There are also a few ways to think about the liquidity, relative to adjacent markets like ETFs, CDX or Total Return Swaps.
First, we can look at the bid/offer as a percentage of the futures price, which makes it more comparable to instruments that trade on the basis of par (with 0.01% analogous to one cent for an instrument trading at 100.0).
Next, we can look at this in terms of basis points of yield by finding the dollar value of the bid/offer spread and dividing it by the DV01 or CR01.
| Symbol | Product | Average Top of Book | Average Bid/Offer (Index Points) | As % of Futures Price | In Basis Points of Yield |
|---|---|---|---|---|---|
| IQB | Investment Grade | $2.1MM | 0.6 | 0.02% | 0.25 |
| HYB | High Yield | $1.9MM | 0.13 | 0.02% | 0.63 |
| DHB | Investment Grade Duration-Hedged | $3.1MM | 0.06 | 0.03% | 0.41 |
| DHY | High Yield Duration-Hedged | $5.8MM | 0.04 | 0.03% | 1.06 |
We can also look at the distribution of the bid/offer observed during the most popular trading window, from 11:00 a.m. to 4:00 p.m. Eastern Time (ET) for September 2025. The Investment Grade contract was 1.0 index points wide or better for 99.5% of the time, while the High Yield contract was 0.2 index points or better for 99.4% of the time.
Who is providing liquidity in this market?
Like most of our futures, more than 95% of volume takes place on a fully anonymous electronic central limit order book (CLOB). This means clients access electronic liquidity from a variety of market makers: over a dozen firms are active, and it’s a similar group of firms that provide liquidity in Treasury futures, Equity Index futures and other products.
In addition to the CLOB, our Credit futures are eligible for block trades, which are generally negotiated OTC voice or chat. Three firms have provided liquidity on block trades, including a mix of bank dealers and non-bank liquidity providers.
What is the largest trade size you’ve seen?
Clients routinely execute trades of $10 million to 20 million notional on the screen, and in some cases we have seen trades of up to $50 million executed electronically by breaking the trade into smaller pieces, and getting passive fills. The order book replenishes quickly during the trading session given the deep bench of electronic market makers.
In blocks we have seen outright trades as large as 480 contracts in IQB (~$50 million in notional), 911 contracts in HYB (~$101 million in notional), and 100 contracts in DHB (~$11 million notional). We have seen calendar spread block trades as large as 518 contracts (259 contracts on each leg).
How did the product respond during April market activity?
In the first few weeks of April, volumes accelerated and we saw multiple new end-users become active. Open interest also continued to grow over this period.
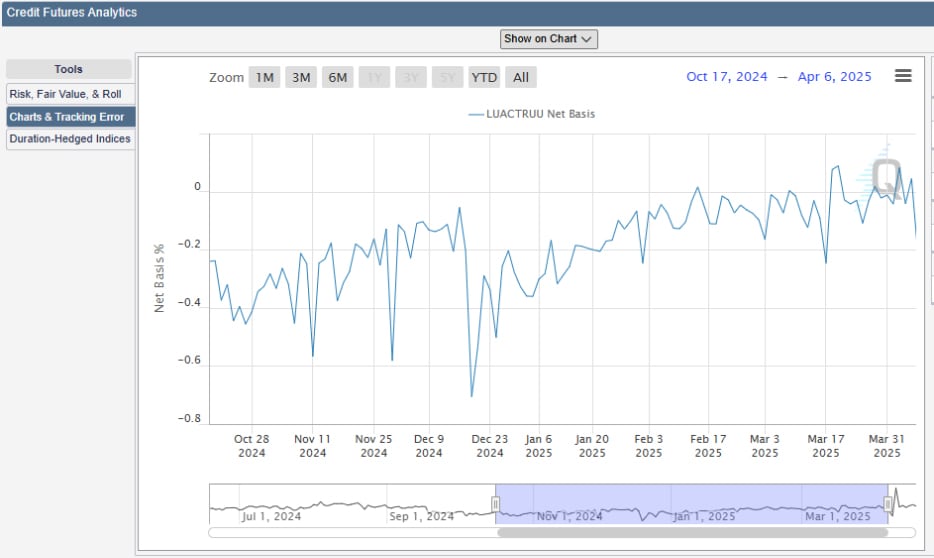
Are the futures generally trading rich or cheap?
This varies by product and by day, and now can be visualized via Credit Futures Analytics, which includes the ability to chart the net basis as a percentage of the index price.
Past performance is not indicative of future results.
Disclosure: CME Group
© [2023] CME Group Inc. All rights reserved. This information is reproduced by permission of CME Group Inc. and its affiliates under license. CME Group Inc. and its affiliates accept no liability or responsibility for the information contained herein, including but not limited to the currency, accuracy and/or completeness of this information, and delays, interruptions, errors or omissions. This information is an unofficial copy and may not reflect the official and accurate version. For the definitive and up-to-date version of any of this information, please see cmegroup.com.
Disclosure: Interactive Brokers Third Party
Information posted on IBKR Campus that is provided by third-parties does NOT constitute a recommendation that you should contract for the services of that third party. Third-party participants who contribute to IBKR Campus are independent of Interactive Brokers and Interactive Brokers does not make any representations or warranties concerning the services offered, their past or future performance, or the accuracy of the information provided by the third party. Past performance is no guarantee of future results.
This material is from CME Group and is being posted with its permission. The views expressed in this material are solely those of the author and/or CME Group and Interactive Brokers is not endorsing or recommending any investment or trading discussed in the material. This material is not and should not be construed as an offer to buy or sell any security. It should not be construed as research or investment advice or a recommendation to buy, sell or hold any security or commodity. This material does not and is not intended to take into account the particular financial conditions, investment objectives or requirements of individual customers. Before acting on this material, you should consider whether it is suitable for your particular circumstances and, as necessary, seek professional advice.
Disclosure: Futures Trading
Futures are not suitable for all investors. The amount you may lose may be greater than your initial investment. Before trading futures, please read the CFTC Risk Disclosure. A copy and additional information are available at the Warnings and Disclosures section of your local Interactive Brokers website.


Join The Conversation
If you have a general question, it may already be covered in our FAQs page. go to: IBKR Ireland FAQs or IBKR U.K. FAQs. If you have an account-specific question or concern, please reach out to Client Services: IBKR Ireland or IBKR U.K..
Visit IBKR U.K. Open an IBKR U.K. Account