


Originally Posted, 25 November 2024 – Is Japan’s Nikkei 225 Still a Bargain?
In late 2023, Japan’s Nikkei 225 stock index rallied to its first record high since 1989. However, when viewed in U.S. dollars (USD), the index broke its 1989 record in 2021, owing to the yen (JPY) weakening from 102 per USD to 142 over the same period. Since 2021, Japanese stocks have rallied in yen terms, but the sharp fall in JPYUSD back towards 160 has led the Nikkei 225 to trade sideways in dollar terms. Viewed from a yen perspective, the index has been trading in a narrow range since late last year and remains near its 1989 peak (Figure 1).
Figure 1: From yen and USD perspectives, Japanese stocks remain near 1989 highs
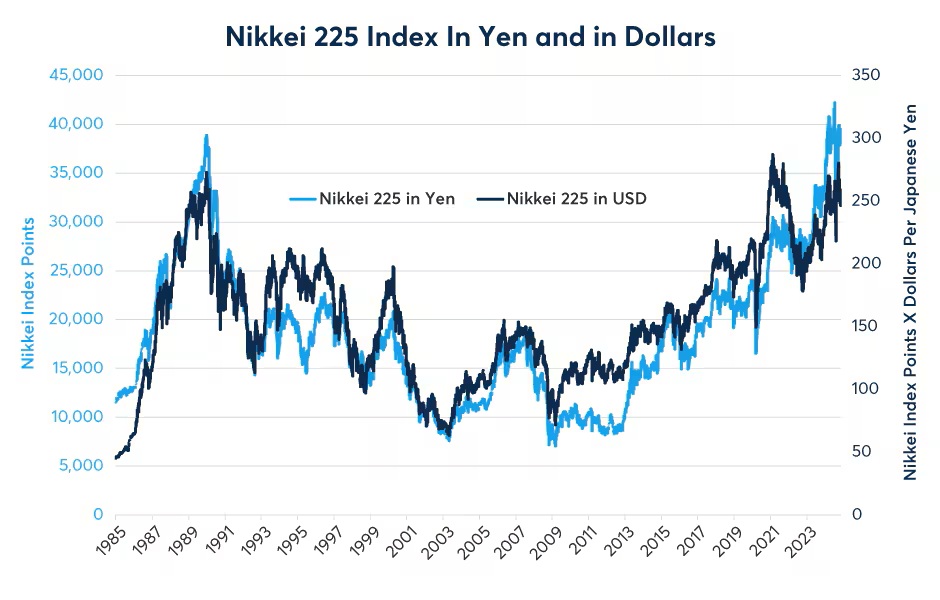
Source: Bloomberg Professional (NKY and JPYUSD), CME Economic Research Calculations – Past performance is not indicative of future results.
The Nikkei 225’s performance over the past 35 years stands in stark contrast to that of the S&P 500. The price return of the Nikkei 225 since December 31, 1989, has been -1.1% in yen terms and -8.6% in dollars. The S&P 500 has returned 1,586% over the same period (Figure 2). If one includes reinvested dividends, the total returns for the Nikkei 225 have been +54% in yen and +42% in USD compared to +3,331% total USD returns for the S&P 500.
Figure 2: U.S. equities have vastly outperformed Nikkei 225 since 1989

Source: Bloomberg Professional (TPX, NKY, SPX and INDU) – Past performance is not indicative of future results.
Back in 1989, Japanese stocks briefly eclipsed the U.S. market in terms of market cap, accounting for about 40% of global developed market capitalization compared to 36% for the U.S. Today, the U.S. accounts for 74% of global developed market capitalization compared to less than 7% for Japan. Indeed, across a variety of valuation measures, Japanese stocks look like a bargain versus their American counterparts.
During the 1980s and 1990s, Japanese stocks paid dividends that were far lower than their American counterparts. Nikkei 225 often had dividend yields of around 0.5-1.0%. Today, the Nikkei 225 has a dividend yield of 1.84%, above what any of the major U.S. indices are currently paying (Figure 3).
Figure 3: Japanese stocks pay higher dividends than their U.S. counterparts

Source: Bloomberg Professional (TPX, NKY, SPX, INDU, NDX and RUY) – Past performance is not indicative of future results.
The Nikkei 225 has an earnings yield (the reciprocal of price-to-earnings ratio) of 4.9%. That’s higher than the S&P 500’s 4.1% and much higher than that of the Nasdaq-100 or the Russell 2000, which are below 3% (Figure 4). Earnings yields are often compared to long-term bond yields. 30-year U.S. Treasuries pay a 4.6% yield; that’s 0.5% higher than the S&P 500’s earnings yield. By contrast, 30Y Japanese Government Bonds (JGBs) pay 2.3%, less than half the earnings yield of the Nikkei 225. This suggest that U.S. stocks could be overvalued with respect to U.S. Treasuries, while Japanese stocks could be a bargain compared to Japan’s domestic bonds. Moreover, such comparisons are even more dramatic if one looks at 10Y yields, which are near 4.4% in the U.S. and only 1.06% in Japan.
Figure 4: Japanese earnings yields are much lower than in the U.S.
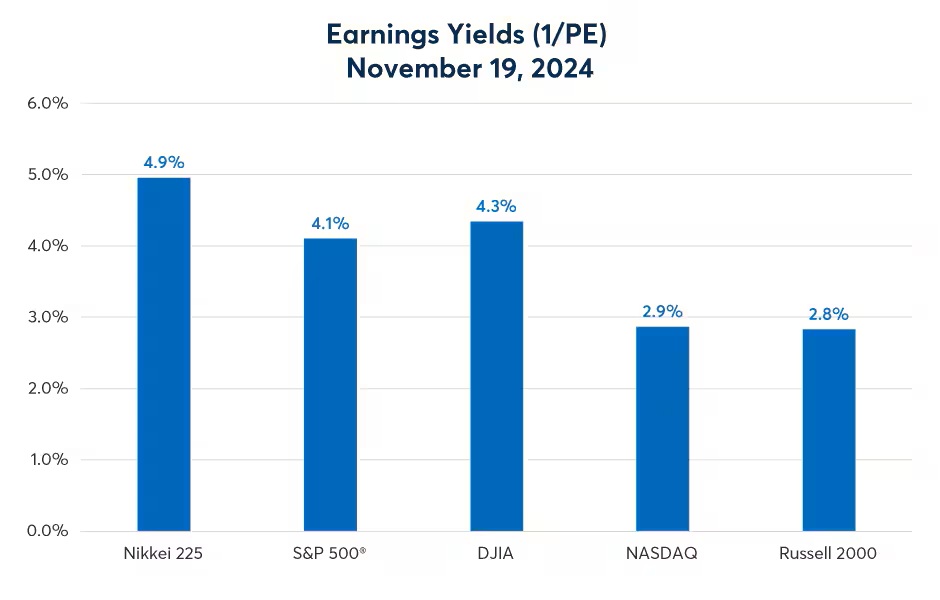
Source: Bloomberg Professional (TPX, NKY, SPX, INDU, NDX and RUY) – Past performance is not indicative of future results.
Other valuation measures such as price-to-sales and price-to-book reinforce the idea that Japanese stocks are a bargain. Nikkei 225 trades at 0.96x sales (annual revenue) and 1.43x book value. For the S&P 500, these numbers are in the 3.1-5.3x range, and for the Nasdaq-100, they are in the 5.4-8.4x range (Figures 5 and 6). Only U.S. small caps compare favorably to Japan.
Figure 5: On a price-to-sales basis, Japanese stocks look like a bargain
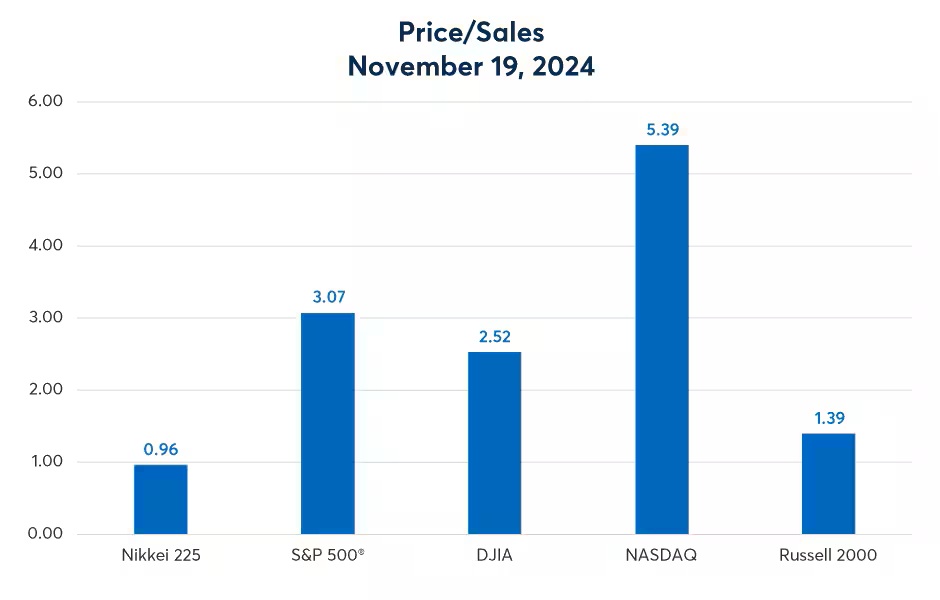
Source: Bloomberg Professional (TPX, NKY, SPX, INDU, NDX and RUY) – Past performance is not indicative of future results.
Figure 6: On a price-to-book basis, Japanese stocks look relatively inexpensive
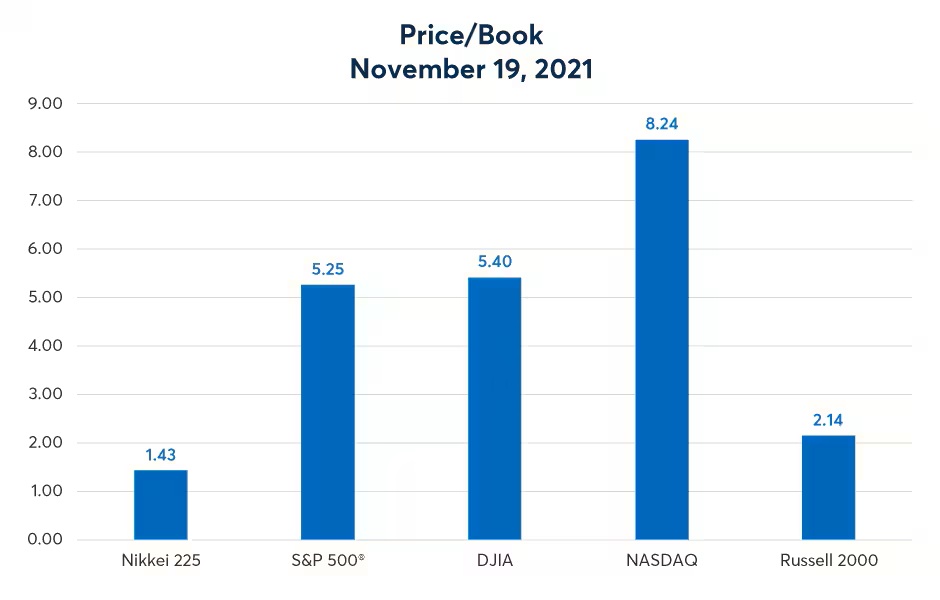
Source: Bloomberg Professional (TPX, NKY, SPX, INDU, NDX and RUY) – Past performance is not indicative of future results.
Japanese stocks have gone from having much higher to much lower valuation ratios than their U.S. counterparts due to major differences between the U.S. and Japan, which include the pace of growth and the kinds of firms included in the respective indices. Since 1989, Japan’s real GDP has expanded by about 40%. In the U.S., real GDP has expanded by 137% over the same period.
The difference in growth can be attributed to faster population growth in the U.S. Japan’s population has shrunk from 123.1 million in 1989 to 122.6 million today. Meanwhile, the U.S. has grown by 40% from 244 million to 341 million over the same period. As such, real GDP per capita in Japan has grown by 41% since 1989, while it has increased by 70% in the U.S.
That said, Japan has the world’s oldest population, with a huge generation of people currently 45-55 years old about to join and an even larger group of people in retirement (Figure 7). Japan has relatively few young people who often drive innovation and growth.
Figure 7: Japan has the most advanced aging of any country

Source: U.S. Census Bureau International Database – Past performance is not indicative of future results.
The U.S., by contrast, has relative healthy demographics with a high-enough birth rate and enough immigration to support its elderly population and replace its workforce, at least for now (Figure 8).
Figure 8: The U.S. has much healthier demographics

Source: U.S. Census Bureau International Database – Past performance is not indicative of future results.
Equity sector weights also differ between the U.S. and Japanese markets. The S&P 500 has a 32% weighting of IInformation Technology (IT) stocks, while the Nikkei 225 has a 24% weighting in this category. That said, U.S. IT stocks have vastly outperformed those of Japan in price terms in recent years.
With valuation ratios growing for U.S. stocks while shrinking for Japanese equities, it’s plausible for Japanese stocks to be a strong source of diversification to a portfolio weighted towards U.S. equities, especially if they struggle to deliver the earnings investors anticipate.
One concern for Japanese stocks beyond demographics could be U.S. trade policy. Exports accounted for 16.8% of Japanese GDP in 2023, of which 18.8% went to the U.S. In other words, about 3.2% of Japanese GDP is exported to the U.S. Should the U.S. impose a 10% or 20% import tariff, that could reduce Japanese GDP by 0.3% to 0.6% and would likely hit the earnings of many of the firms in the Nikkei 225 accordingly. Sometimes, markets can react more strongly to such changes than economic fundamentals warrant.
Finally, there is the risk of the Japanese currency. USD and yen-denominated Nikkei 225 are impacted by currency movements in different ways. A weaker yen typically helps JPY-denominated Nikkei 225 by boosting the value of both exports and as well as financial and property, plant and equipment investments held abroad. From a USD perspective, however, a weaker yen usually more than negates these advantages (Figure 9).
Figure 9: JPY-denominated Nikkei has typically had a negative correlation with JPY since 2007

Source: Bloomberg Professional (NKY and JPYUSD), CME Economic Research Calculations – Past performance is not indicative of future results.
For its part, the yen has been a rapidly moving currency and could be a continued source of volatility both for domestic and foreign investors in the Nikkei 225 (Figure 10). For a deeper analysis of the Japanese yen and its relationship with demographics and debt levels, please see our recent article.
Figure 10: The yen has dramatically weakened since 2013 and has had a volatile 2024

Source: Bloomberg Professional (BOJBPBAL and JPY) – Past performance is not indicative of future results.
Disclosure: CME Group
© [2023] CME Group Inc. All rights reserved. This information is reproduced by permission of CME Group Inc. and its affiliates under license. CME Group Inc. and its affiliates accept no liability or responsibility for the information contained herein, including but not limited to the currency, accuracy and/or completeness of this information, and delays, interruptions, errors or omissions. This information is an unofficial copy and may not reflect the official and accurate version. For the definitive and up-to-date version of any of this information, please see cmegroup.com.
Disclosure: Interactive Brokers Third Party
Information posted on IBKR Campus that is provided by third-parties does NOT constitute a recommendation that you should contract for the services of that third party. Third-party participants who contribute to IBKR Campus are independent of Interactive Brokers and Interactive Brokers does not make any representations or warranties concerning the services offered, their past or future performance, or the accuracy of the information provided by the third party. Past performance is no guarantee of future results.
This material is from CME Group and is being posted with its permission. The views expressed in this material are solely those of the author and/or CME Group and Interactive Brokers is not endorsing or recommending any investment or trading discussed in the material. This material is not and should not be construed as an offer to buy or sell any security. It should not be construed as research or investment advice or a recommendation to buy, sell or hold any security or commodity. This material does not and is not intended to take into account the particular financial conditions, investment objectives or requirements of individual customers. Before acting on this material, you should consider whether it is suitable for your particular circumstances and, as necessary, seek professional advice.


Join The Conversation
If you have a general question, it may already be covered in our FAQs page. go to: IBKR Ireland FAQs or IBKR U.K. FAQs. If you have an account-specific question or concern, please reach out to Client Services: IBKR Ireland or IBKR U.K..
Visit IBKR U.K. Open an IBKR U.K. Account