


Originally Posted 01 September 2025 – Waiting for the small-cap resurgence
Author: Toby Warburton, CFA, Ph.D.
Returns for smaller capitalization stocks have lagged those of their larger counterparts since the 1980s, notwithstanding periodic outperformance in that time. But markets are cyclical and as the post-COVID bull market draws on and the mega-cap names continue to drive markets to all-time highs, we believe it is timely to revisit the prospects for smaller companies.
The rationale for investing in small-cap stocks is long established. At its core, the investment case centers on the opportunity to access exciting companies, often early in their life cycle when growth rates can be very high. The small-cap premium (or ’size effect’) was first documented in 19811 , and demonstrated the long-term outperformance of small caps over large caps. Explanations for this premium span risk-based justification (e.g., that small caps are inherently riskier, so investors require a higher return for holding them) through to market structure and behavioural rationale. This latter argument is based on small caps being under-researched, having low investment analyst coverage, and investors often being biased towards larger, more glamorous names. It follows that small caps are all too often priced cheaply and therefore hold the potential to outperform over the long term.
Unfortunately, academic theory and market reality do not always necessarily dovetail neatly, and small caps have not delivered the returns expected of higher-growth stocks that appeared undervalued. For example, if we look at large cap and small cap US equity returns, where the size effect was first uncovered, we can divide the period after the market crash in 1987 into four sub-periods.

Past Performance is not indicative of future results

Past performance is not indicative of future results
The first period was the long bull market from 1987 to late 1999 (Figure 1a). Large-cap names significantly outperformed over that period, especially in the final throes of the “TMT bubble” towards the end of 1999. However, in the deflation of that bubble those large-cap stocks underperformed and continued to be weaker than small caps until the Global Financial Crisis (GFC) and ensuing bear market of 2008 and 2009. In the GFC-induced market crash, risk worries decimated smaller names as investors gravitated towards the larger more well-known names rather than riskier small caps.
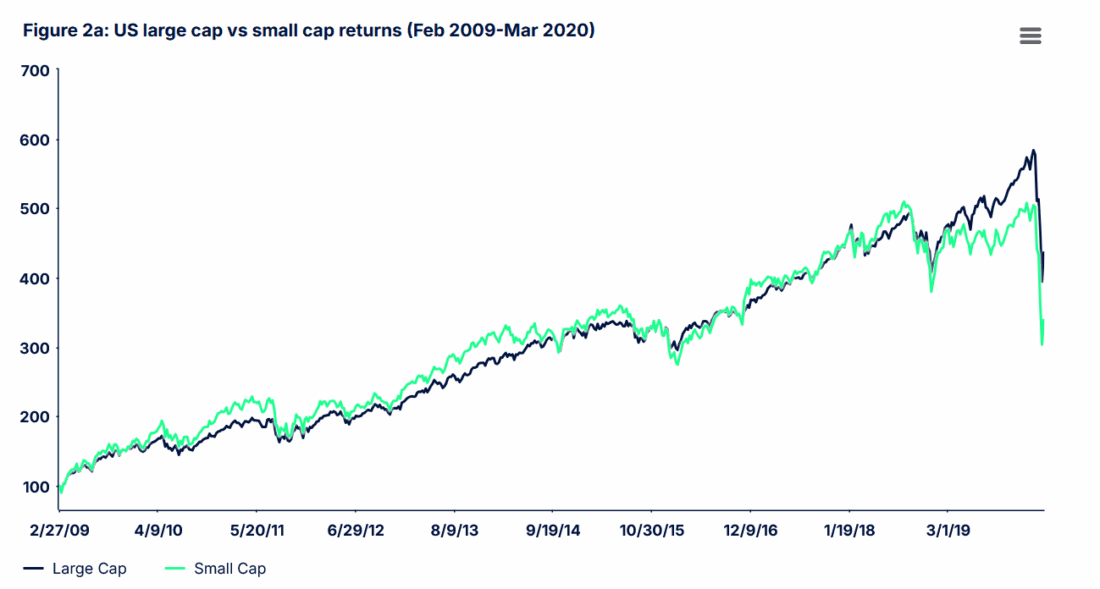
As equity markets recovered after the GFC, there were periods of small-cap outperformance, followed by larger caps catching up, with no clear winner up until 2020. In the initial stages of the COVID pandemic and the perception of an existential threat to many smaller companies, the small-cap index underperformed significantly — something it is prone to do in times of panic (Figure 2a).
Past Performance is not indicative of future results
Past Performance is not indicative of future results
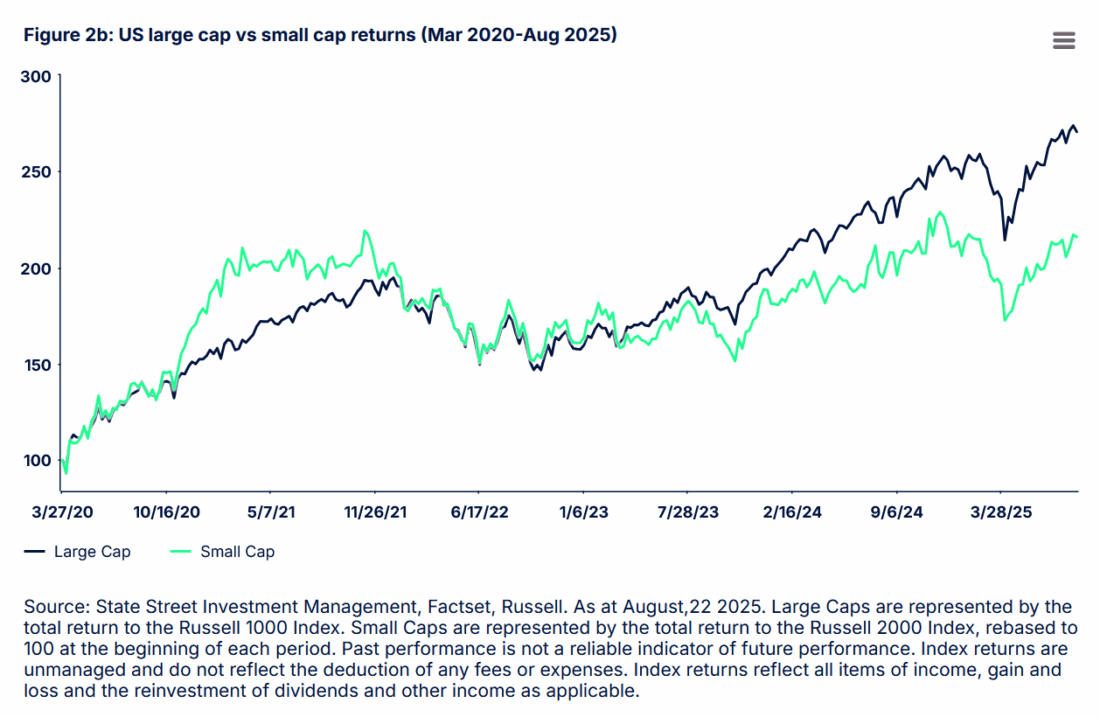
However, markets began to quickly recover as panic turned to rampant enthusiasm as governments globally took steps to keep companies, markets, and their populations afloat. And amid the euphoria around the discovery of the effectiveness of the first COVID vaccines, small caps significantly rallied even above the impressive large-cap boom. (Figure 2b)
As we moved into the more recent era of AI euphoria, hyperscalers, and a winner-takes-all mentality, the small-cap index has been left in the wake of the large-cap index advance powered by the Magnificent Seven group of stocks.
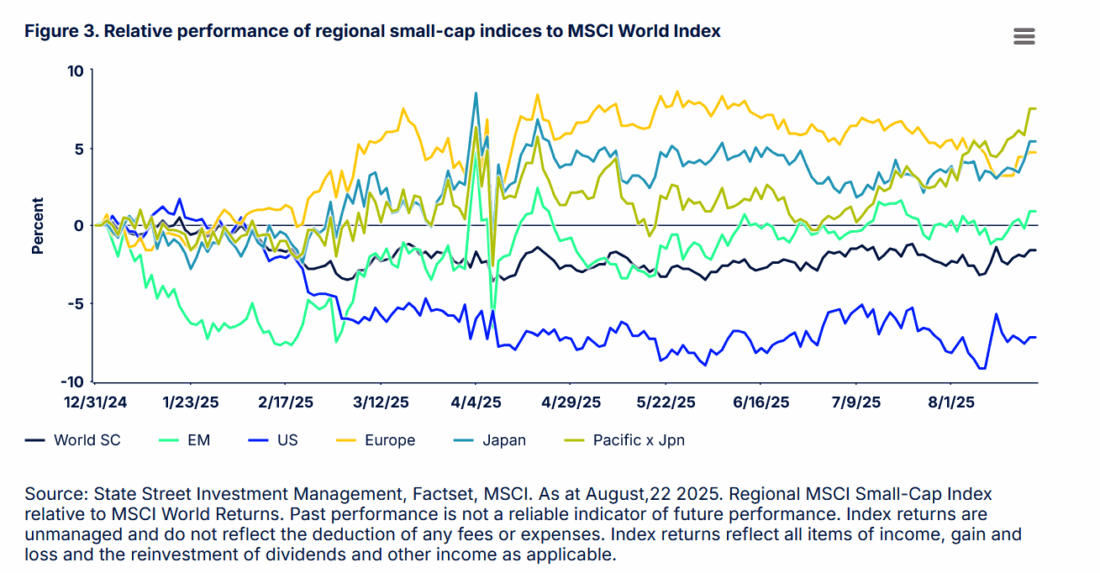
While smaller names have struggled over this nearly 40-year period to match the gains of their larger counterparts, there have been pockets of encouragement. This is especially the case when looking outside of the US equity market. So far this year, small-cap indices in Europe, Japan, Pacific, and Emerging Markets have outperformed the MSCI World (large cap) Index, despite the heavy weighting of outperforming mega-cap US names in the broad market index. Relative underperformance has been concentrated in US names. (Figure 3)
Past performance is not indicative of future results
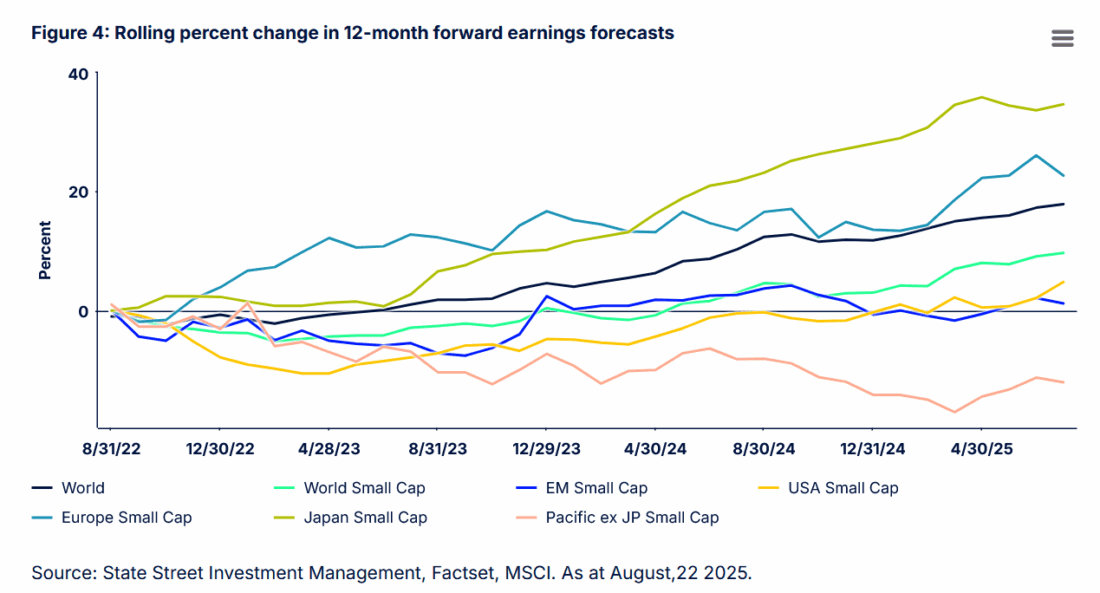
Over the longer term, outperformance from the mega-cap names has been tied to earnings; but more recently, small-cap earnings forecasts have mostly kept in touch with large caps globally. Signs of an uptick, most notably in Europe and Japan, suggest the significant valuation discount for the smaller end of the spectrum may no longer be warranted.
Past performance is not indicative of future results

Past performance is not indicative of future results
The bottom line
We don’t really subscribe to the theory that the small-cap premium is dead or was never alive to start with. But we do recognize that smaller names have not delivered in aggregate in terms of earnings and returns over the long term. The valuation discount that small caps hold offers some optionality however, and even a stabilization of relative earnings and reduction in risk premia, or a lowering of interest rates, may signal a long-awaited sustained rally in small-cap names.
Even as we wait for that rally, as active investors we believe we can find hidden gems within the small-cap universe. Inefficiency caused by lower information availability, low analyst coverage, weaker liquidity, and higher trading costs allows an active systematic approach to pick off those higher quality names with positive sentiment that can be found at a reasonable price (taking account of trading costs). This allows us to build attractive portfolios while we wait for the broader market to pick up.
Disclosure: State Street Global Advisors
Do not reproduce or reprint without the written permission of SSGA.
All information has been obtained from sources believed to be reliable, but its accuracy is not guaranteed. There is no representation or warranty as to the current accuracy, reliability or completeness of, nor liability for, decisions based on such information and it should not be relied on as such.
State Street Global Advisors and its affiliates (“SSGA”) have not taken into consideration the circumstances of any particular investor in producing this material and are not making an investment recommendation or acting in fiduciary capacity in connection with the provision of the information contained herein.
ETFs trade like stocks, are subject to investment risk, fluctuate in market value and may trade at prices above or below the ETF’s net asset value. Brokerage commissions and ETF expenses will reduce returns.
Bonds generally present less short-term risk and volatility than stocks, but contain interest rate risk (as interest rates raise, bond prices usually fall); issuer default risk; issuer credit risk; liquidity risk; and inflation risk. These effects are usually pronounced for longer-term securities. Any fixed income security sold or redeemed prior to maturity may be subject to a substantial gain or loss.
Investing involves risk including the risk of loss of principal.
The whole or any part of this work may not be reproduced, copied or transmitted or any of its contents disclosed to third parties without SSGA’s express written consent.
Investing in high yield fixed income securities, otherwise known as “junk bonds”, is considered speculative and involves greater risk of loss of principal and interest than investing in investment grade fixed income securities. These Lower-quality debt securities involve greater risk of default or price changes due to potential changes in the credit quality of the issuer.
COPYRIGHT AND OTHER RIGHTS
Other third party content is the intellectual property of the respective third party and all rights are reserved to them. All rights reserved. No organization or individual is permitted to reproduce, distribute or otherwise use the statistics and information in this report without the written agreement of the copyright owners.
Definition:
Arbitrage: the simultaneous buying and selling of securities, currency, or commodities in different markets or in derivative forms in order to take advantage of differing prices for the same asset.
Fund Objectives:
SPY: The investment seeks to provide investment results that, before expenses, correspond generally to the price and yield performance of the S&P 500® Index. The Trust seeks to achieve its investment objective by holding a portfolio of the common stocks that are included in the index (the “Portfolio”), with the weight of each stock in the Portfolio substantially corresponding to the weight of such stock in the index.
VOO: The investment seeks to track the performance of a benchmark index that measures the investment return of large-capitalization stocks. The fund employs an indexing investment approach designed to track the performance of the Standard & Poor’s 500 Index, a widely recognized benchmark of U.S. stock market performance that is dominated by the stocks of large U.S. companies. The advisor attempts to replicate the target index by investing all, or substantially all, of its assets in the stocks that make up the index, holding each stock in approximately the same proportion as its weighting in the index.
IVV: The investment seeks to track the investment results of the S&P 500 (the “underlying index”), which measures the performance of the large-capitalization sector of the U.S. equity market. The fund generally invests at least 90% of its assets in securities of the underlying index and in depositary receipts representing securities of the underlying index. It may invest the remainder of its assets in certain futures, options and swap contracts, cash and cash equivalents, as well as in securities not included in the underlying index, but which the advisor believes will help the fund track the underlying index.
The funds presented herein have different investment objectives, costs and expenses. Each fund is managed by a different investment firm, and the performance of each fund will necessarily depend on the ability of their respective managers to select portfolio investments. These differences, among others, may result in significant disparity in the funds’ portfolio assets and performance. For further information on the funds, please review their respective prospectuses.
Entity Disclosures:
The trademarks and service marks referenced herein are the property of their respective owners. Third party data providers make no warranties or representations of any kind relating to the accuracy, completeness or timeliness of the data and have no liability for damages of any kind relating to the use of such data.
SSGA Funds Management, Inc. serves as the investment advisor to the SPDR ETFs that are registered with the United States Securities and Exchange Commission under the Investment Company Act of 1940. SSGA Funds Management, Inc. is an affiliate of State Street Global Advisors Limited.
Intellectual Property Disclosures:
Standard & Poor’s®, S&P® and SPDR® are registered trademarks of Standard & Poor’s® Financial Services LLC (S&P); Dow Jones is a registered trademark of Dow Jones Trademark Holdings LLC (Dow Jones); and these trademarks have been licensed for use by S&P Dow Jones Indices LLC (SPDJI) and sublicensed for certain purposes by State Street Corporation. State Street Corporation’s financial products are not sponsored, endorsed, sold or promoted by SPDJI, Dow Jones, S&P, their respective affiliates and third party licensors and none of such parties make any representation regarding the advisability of investing in such product(s) nor do they have any liability in relation thereto, including for any errors, omissions, or interruptions of any index.
BLOOMBERG®, a trademark and service mark of Bloomberg Finance, L.P. and its affiliates, and BARCLAYS®, a trademark and service mark of Barclays Bank Plc., have each been licensed for use in connection with the listing and trading of the SPDR Bloomberg Barclays ETFs.
Distributor: State Street Global Advisors Funds Distributors, LLC, member FINRA, SIPC, an indirect wholly owned subsidiary of State Street Corporation. References to State Street may include State Street Corporation and its affiliates. Certain State Street affiliates provide services and receive fees from the SPDR ETFs.
ALPS Distributors, Inc., member FINRA, is distributor for SPDR® S&P 500®, SPDR® S&P MidCap 400® and SPDR® Dow Jones Industrial Average, all unit investment trusts. ALPS Distributors, Inc. is not affiliated with State Street Global Advisors Funds Distributors, LLC.
Before investing, consider the funds’ investment objectives, risks, charges, and expenses. For SPDR funds, you may obtain a prospectus or summary prospectus containing this and other information by calling 1‐866‐787‐2257 or visiting www.spdrs.com. Please read the prospectus carefully before investing.
Disclosure: Interactive Brokers Third Party
Information posted on IBKR Campus that is provided by third-parties does NOT constitute a recommendation that you should contract for the services of that third party. Third-party participants who contribute to IBKR Campus are independent of Interactive Brokers and Interactive Brokers does not make any representations or warranties concerning the services offered, their past or future performance, or the accuracy of the information provided by the third party. Past performance is no guarantee of future results.
This material is from State Street Global Advisors and is being posted with its permission. The views expressed in this material are solely those of the author and/or State Street Global Advisors and Interactive Brokers is not endorsing or recommending any investment or trading discussed in the material. This material is not and should not be construed as an offer to buy or sell any security. It should not be construed as research or investment advice or a recommendation to buy, sell or hold any security or commodity. This material does not and is not intended to take into account the particular financial conditions, investment objectives or requirements of individual customers. Before acting on this material, you should consider whether it is suitable for your particular circumstances and, as necessary, seek professional advice.
Disclosure: Futures Trading
Futures are not suitable for all investors. The amount you may lose may be greater than your initial investment. Before trading futures, please read the CFTC Risk Disclosure. A copy and additional information are available at the Warnings and Disclosures section of your local Interactive Brokers website.
Disclosure: Bonds
As with all investments, your capital is at risk.
Disclosure: ETFs
Any discussion or mention of an ETF is not to be construed as recommendation, promotion or solicitation. All investors should review and consider associated investment risks, charges and expenses of the investment company or fund prior to investing. Before acting on this material, you should consider whether it is suitable for your particular circumstances and, as necessary, seek professional advice.


Join The Conversation
If you have a general question, it may already be covered in our FAQs page. go to: IBKR Ireland FAQs or IBKR U.K. FAQs. If you have an account-specific question or concern, please reach out to Client Services: IBKR Ireland or IBKR U.K..
Visit IBKR U.K. Open an IBKR U.K. Account