


Originally Posted, August 13, 2025 – Are tech sector investors too bullish on AI’s promise?
As artificial intelligence reshapes the technology landscape, investors are weighing high valuations against long-term growth potential. In this question and answer (Q&A) session, Portfolio Manager Richard Clode explains why this time may be different from the dot-com era.

Key takeaways:
- The tech sector today is fundamentally stronger than in 2000, being
more diverse, profitable, resilient, and embedded across multiple sectors. - While valuations are elevated, the global tech leaders are supported by earnings and revenue growth.
- The massive capital expenditure in AI reflects a long-term investment in a generational technology shift. Tax incentives and real-world use cases are helping justify these investments, but selectivity in identifying true AI winners is crucial.
Q: Investors are drawing parallels between the dot.com bubble and the excitement around the AI wave today, with a particular focus on the capital expenditure (capex) versus profitability debate. What makes this time different?
The technology sector has evolved significantly compared to 2000 when there was effectively one bet on the enterprise internet opportunity. Today, there is much more diversity across end customer, end technology and business models. This is reflected in the breadth of technology companies represented across different sectors in indices like MSCI, with Amazon residing in Consumers, Netflix sitting in Communication Services, Uber in Industrials, and Visa and Mastercard in Financials. Alphabet and Meta are in Communication Services, a new sector established in 2018 to encompass the remaining internet companies alongside telecom companies.
Exposure to the technology sector is broader than narrow benchmark and GICS classifications. Tech leaders that are correctly identified can provide investors with exposure to innovation, secular growth, disruption, strong profit margins and balance sheets. Companies like these offer a lot more resilience and ‘offence’ in terms of growth and innovation.
Many of the leading technology companies today are also much more profitable and have much stronger balance sheets versus 2000 (Figure 1).
Figure 1: Tech companies have the strongest balance sheets
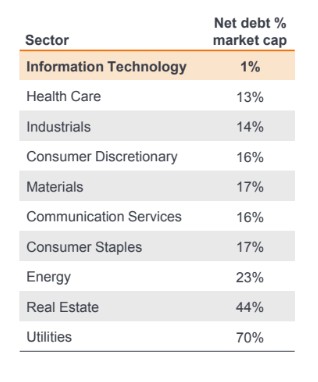
Source: UBS, as at 14 July 2025. Data is for MSCI World Sector Indices excluding the Financials sector. ’Net debt as % of market cap’ is a measure of the net debt (debt minus cash and cash equivalents) on a company’s balance sheet as a percentage of its total market capitalisation. Past performance does not predict future returns.
Q: Has the stock valuation process for the Global Technology Leaders Team evolved over the years?
We continue to use the same valuation techniques as we did in 2000, focused on price-to-earnings (P/E) ratios and free cash flow (FCF) yields. There’s a big difference in the number of unprofitable companies and their P/E ratios. Back in the first quarter of 2000, around 36% of US tech companies were unprofitable, versus 21% in Q1 251. The Magnificent 7 today trade on a P/E of almost 40x forward earnings, but taking out Tesla on >100x P/E and the rest trade on a mid-20x P/E ratio, which is well below the leading tech stocks in 2000 with many more on >1000x P/E. We also think a lower PEG (price/earnings to growth) ratio, is a good indicator of underappreciated earnings, which we believe is a good guide to future returns (Figure 2).
Figure 2: Unappreciated earnings growth drives returns, not P/Es
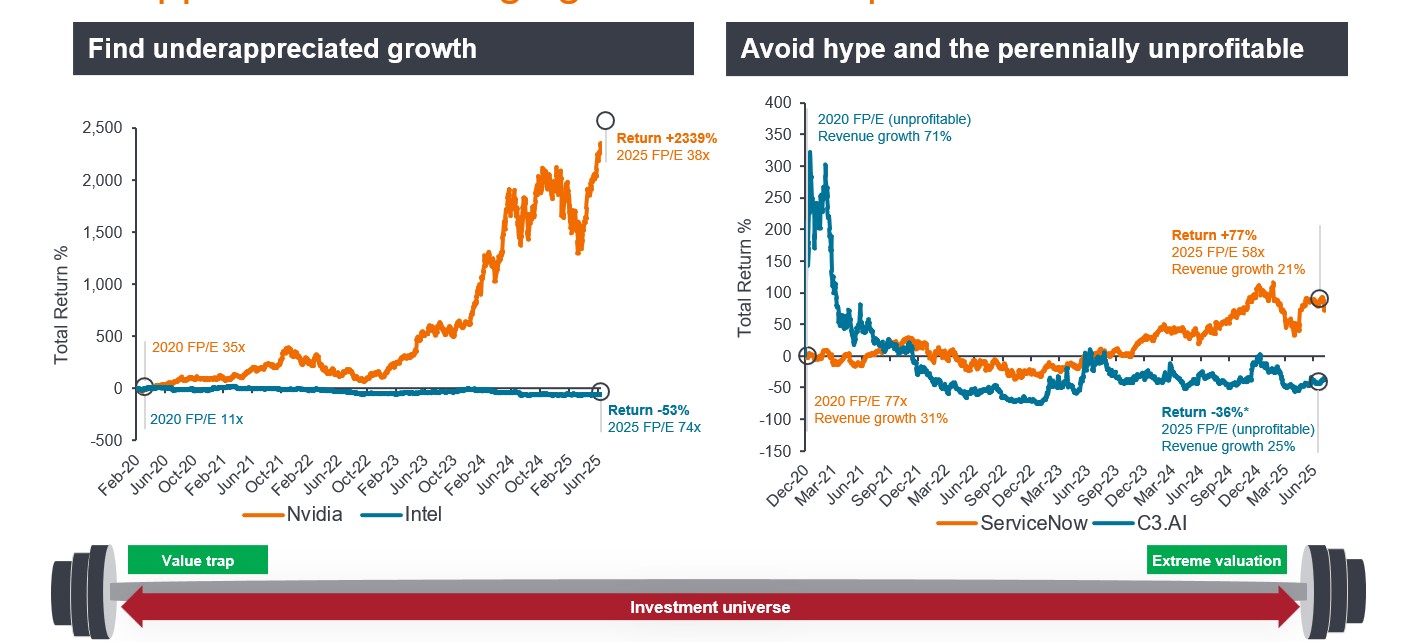
Source: Janus Henderson Investors, Bloomberg, total returns in US dollars, as at 14 July 2025.
Note: Performance is total return in USD. Current FP/E is Forward PE Ratio using current annuals (2025). *Return calculated from IPO date on 8 December 2020. References made to individual securities do not constitute a recommendation to buy, sell or hold any security, investment strategy or market sector, and should not be assumed to be profitable. Janus Henderson Investors, its affiliated advisor, or its employees, may have a position in the securities mentioned. There is no guarantee that past trends will continue, or forecasts will be realised. Past performance does not predict future returns.
Q: Given the tech sector’s strong performance in recent years are we heading towards bubble territory?
NVIDIA, the first company to surpass US$4 trillion in market capitalisation and the leader of the AI technology wave, currently trades on >30x P/E for next year.2 While relatively high, we believe this is not indicative of bubble territory – consider that the tech sector was trading on 50x P/E when the dot.com bubble burst. Microsoft too recently passed this market cap milestone. This time around, some of the high valuations have been backed by strong revenue and profits, unlike many companies back in 2000, which had burned through their funding without ever seeing a dollar of profit.
The technology sector continues to take market share of the global economy through its innovation and disruption. Over the past 20 years we have all changed the way we live our daily lives. Those new habits often include giving more money to technology companies driving the superior earnings growth of the so-called ‘FAANG’ that came to dominate the stock market. Now the same thing is happening in the AI wave led by NVIDIA, but we expect there will be many more new AI leaders in the years to come. As we all use more AI in the future, that will open up larger, new growth markets for technology to take market share, and continue to outpace the rest of the market in terms of earnings growth.
Q: Collectively, Alphabet, Amazon, Meta and Microsoft are committing about US$350 billion in capital expenditure this year, and more than US$400 billion next year. 3 Are we anywhere near peak capex?
AI is akin to an ‘arms race’ for companies and countries. We don’t foresee any pull back on capex anytime soon given we are early on in this generational technology with ever-increasing addressable markets and use cases. As with every true tech wave like the PC, mobile, and internet, the long investment horizons require significant investment to realise its true growth potential.
The mega cap tech companies are investing in datacentres, talent and chips, and now we have reached the stage where the dollars are shifting from being used to train up large language models (LLMs) to actual use cases. This is instilling more confidence for both companies and investors in terms of justification for the huge capex amounts that we are seeing. Funding rounds from OpenAI and xAI recently, as well as Anthropic finalising soon support this narrative.
Another key development has been tax reform via President Trump’s One Big Beautiful Bill Act. Among the measures announced, Companies can now expense 100% of domestic research and development (R&D), with permanent extension of the 100% bonus depreciation for qualified capital expenditure, allowing also retroactive expenses from capitalised R&D from 2022-24.4 For big tech companies that spend tens of billions on R&D and AI/cloud infrastructure, this is a major benefit from a taxation and cash flow perspective.
That said, while we may be nowhere near peak capex, we have to be even more selective when identifying the AI leaders and the true beneficiaries as the next stages of AI development and the associated investment opportunities arise.
Q: Why does an active investment approach make sense for tech?
The technology sector provides access to a plethora of great, innovative companies with strong profit growth and balance sheets. While the current economic, geopolitical and technological landscape differs from that of the dot.com years, the AI wave will last for multiple years, with multiple up and down periods, and hype cycles. Coupled with the return of cost of capital, concentration risk in a small number of dominant tech stocks and geopolitical risks, an active approach should serve investors well.
1Bernstein, as at 14 July 2025. % of unprofitable technology stocks/among largest 1500 stocks in the US. Past performance does not predict future returns.
2 Nasdaq,com, NVIDIA consensus P/E for fiscal year ending January 2027 =33.85x, data as at 8 August 2025.
3 FT.com, ‘Investors glimpse pay-off for Big Tech’s mammoth spending on AI arms race’; 1 August 2025.
4 Morgan Stanley Research, The Big Beautiful Tech Tax Bill; 22 July 2025.
Disclosure: Janus Henderson
The opinions and views expressed are as of the date published and are subject to change without notice. They are for information purposes only and should not be used or construed as an offer to sell, a solicitation of an offer to buy, or a recommendation to buy, sell or hold any security, investment strategy or market sector. No forecasts can be guaranteed. Opinions and examples are meant as an illustration of broader themes and are not an indication of trading intent. It is not intended to indicate or imply that any illustration/example mentioned is now or was ever held in any portfolio. Janus Henderson Group plc through its subsidiaries may manage investment products with a financial interest in securities mentioned herein and any comments should not be construed as a reflection on the past or future profitability. There is no guarantee that the information supplied is accurate, complete, or timely, nor are there any warranties with regards to the results obtained from its use. Past performance is no guarantee of future results. Investing involves risk, including the possible loss of principal and fluctuation of value.
Disclosure: Interactive Brokers Third Party
Information posted on IBKR Campus that is provided by third-parties does NOT constitute a recommendation that you should contract for the services of that third party. Third-party participants who contribute to IBKR Campus are independent of Interactive Brokers and Interactive Brokers does not make any representations or warranties concerning the services offered, their past or future performance, or the accuracy of the information provided by the third party. Past performance is no guarantee of future results.
This material is from Janus Henderson and is being posted with its permission. The views expressed in this material are solely those of the author and/or Janus Henderson and Interactive Brokers is not endorsing or recommending any investment or trading discussed in the material. This material is not and should not be construed as an offer to buy or sell any security. It should not be construed as research or investment advice or a recommendation to buy, sell or hold any security or commodity. This material does not and is not intended to take into account the particular financial conditions, investment objectives or requirements of individual customers. Before acting on this material, you should consider whether it is suitable for your particular circumstances and, as necessary, seek professional advice.


Join The Conversation
If you have a general question, it may already be covered in our FAQs page. go to: IBKR Ireland FAQs or IBKR U.K. FAQs. If you have an account-specific question or concern, please reach out to Client Services: IBKR Ireland or IBKR U.K..
Visit IBKR U.K. Open an IBKR U.K. Account