











Originally posted 27 May 2026 : The Growing Divide Between Equity Indices and Dividend Futures
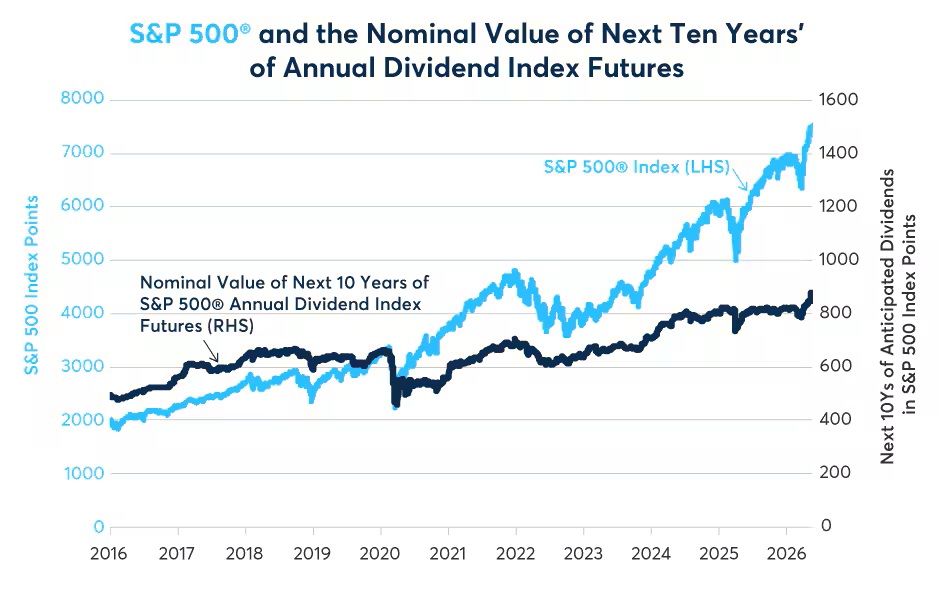
Why are expected dividend payouts at current net present values lagging far behind the surge in equities? Since 2016, the S&P 500 has grown by a staggering 275%. Yet over the same period, investors had priced dividends over the next decade in S&P 500 Annual Dividend Index futures to rise by just 76% (Figure 1). There’s more. When discounted using SOFR Overnight Index Swap (OIS) rates, the net present value (NPV) of the anticipated cash flows presents an even starker anomaly, growing just 56% (Figure 2).
The widening gap between price appreciation and implied dividend growth is not unique to the S&P 500; a similar divergence is currently playing out across the Russell 2000 and Nasdaq 100. Resolving this apparent contradiction requires looking beyond top-down macro assumptions to examine the shifting sector weights of the underlying indices.
Figure 1: Since early 2016, the S&P 500 is up 275%, expected dividends up only 76%
Source: Bloomberg Professional (ASDZ15-36 and SPX), CME Economic Research Calculations – Past performance is not indicative of future results.
Figure 2: Since 2016, the S&P 500 is up 275%, the NPV of dividends only 56%

Source: Bloomberg Professional (USOSFR1…USOSFR10, ASDZ15-36 and SPX), CME Economic Research Calculations – Past performance is not indicative of future results.
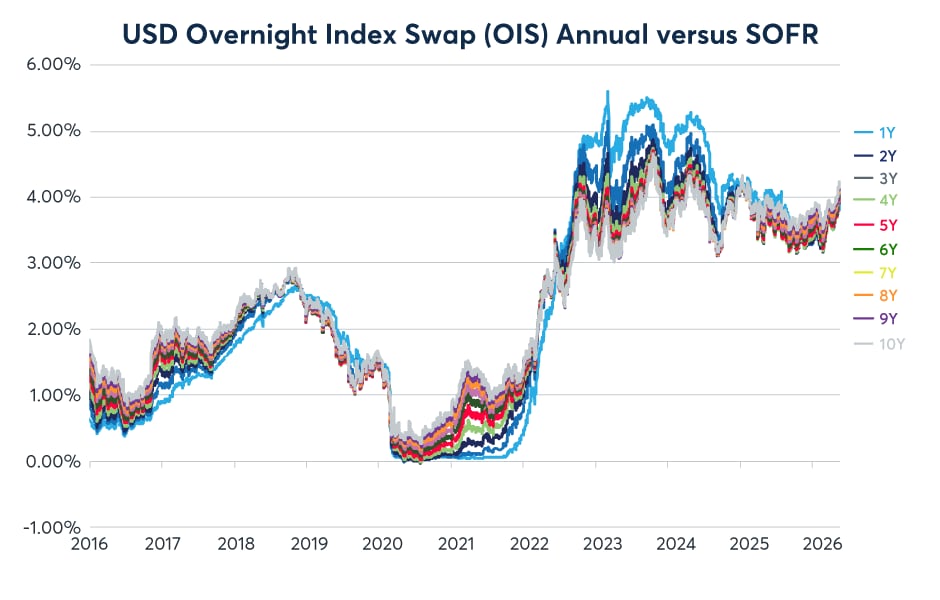
To understand how these index weights have shifted, one must first isolate the dual forces driving this valuation gap: the mathematical impact of rising discount rates and the structural dominance of low-yield growth sectors. The gap between the nominal and NPV growth rates directly reflects the rise in interest rates over the past decade (Figure 3). As interest rates rise, the present value of cash flows further in the future mechanically declines. For example, in early 2016, when 10Y swap futures traded at 1.83%, the discount factor for dividends paid 10 years in the future was:
1/(1+1.83%)10=0.83
Today, with 10Y swap rates hovering near 4.16%, that same discount factor has fallen to:
1/(1+4.16%)10=0.67
While a higher discount rate should theoretically suppress the current price of long-duration growth equities as well, the price indices have defied this gravitational pull. After all, a higher discount rate not only lowers the NPV of future dividends, but of future corporate cash flows by any measure—including profits and free cash flow to equity.
Figure 3: Rising interest rates means a lower NPV of future cash flows
Source: Bloomberg Professional (USOSFR1 … USOSFR10) – Past performance is not indicative of future results.
Yet, the rapid expansion of technology sector weights has completely overwhelmed this interest rate effect.
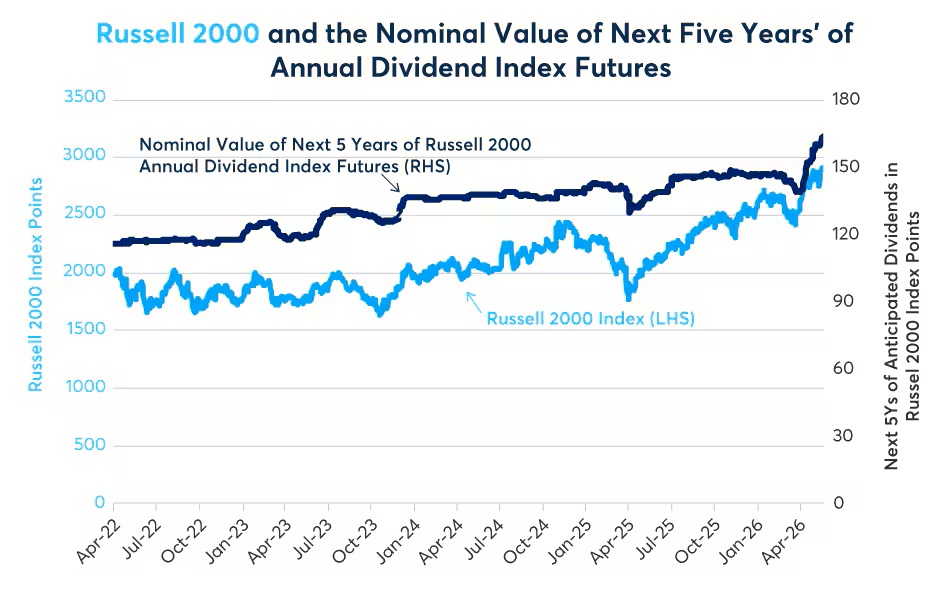
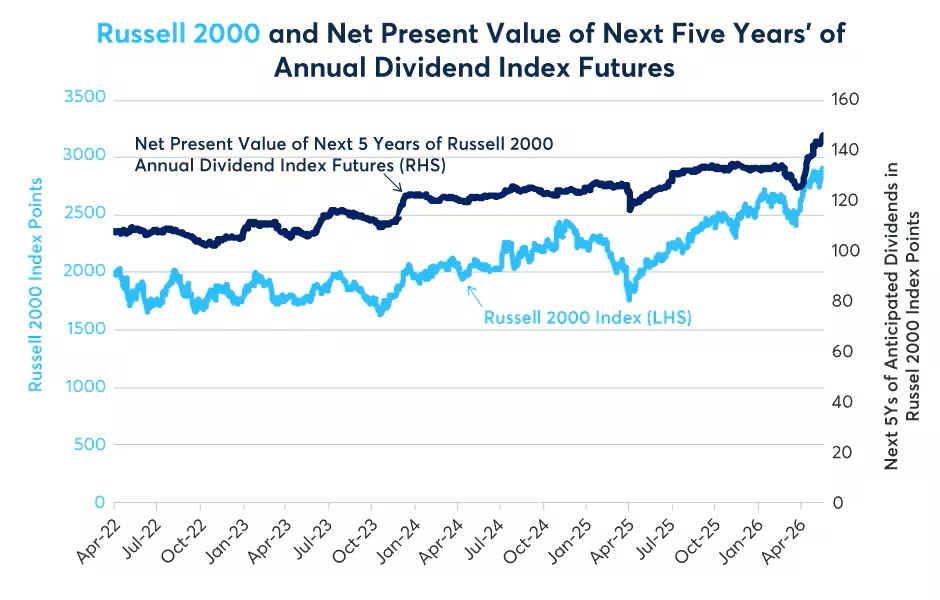
A similar phenomenon is underway across the broader equity landscape. While the historical data for Russell 2000 and Nasdaq 100 Annual Dividend Index futures is shorter—dating back to April 2022—the past four years confirm that the divergence between index prices and dividend aggregates is a systemic, cross-index reality rather than S&P 500 specific (Figures 4, 5, 6, and 7).
Figure 4: Since April 2022, R2K is up 44%; anticipated R2K dividends are up 38%
Source: Bloomberg Professional (RDIZ22-RD|Z30 and RTY), CME Economic Research Calculations – Past performance is not indicative of future results.
Figure 5: Since April 2022, R2K is up 44%; anticipated R2K dividend NPV is up 33%
Source: Bloomberg Professional (USOSFR1…USOSFR10, RDIZ22-30 and RTY), CME Economic Research Calculations – Past performance is not indicative of future results.
Figure 6: The Nasdaq 100 is +105% since April ’22; anticipated dividends are +59%

Source: Bloomberg Professional (ODL22-ODL30 and NDX), CME Economic Research Calculations – Past performance is not indicative of future results.
Figure 7: The Nasdaq 100 is +105% since April ’22 while the NPV of anticipated dividends is up just 53% over the same period

Source: Bloomberg Professional (USOSFR1..USOSFR10, ODLZ22-30 and NDX), CME Economic Research Calculations – Past performance is not indicative of future results.
Since April 2022, the Russell 2000 index has climbed 44%, while its nominal anticipated dividends rose 38%, and their corresponding NPV increased by just 33%. The contrast is even more pronounced in the large-cap growth space: Nasdaq 100 has surged 105% since April 2022, while its expected five-year dividend aggregate grew 59% in nominal terms and a mere 53% in NPV terms.
What explains this uniform tendency for equity index prices to outpace both nominal and discounted dividend expectations? The answer lies in shifts in sector concentration—specifically, the out-performance of the information technology sector.
As shown in Figure 1, the S&P 500 index began significantly detaching from expected dividends around April 2020. This is the exact moment the technology sector’s price performance separated from all other industry groups (Figure 8). This price surge created a mathematical drag on aggregate dividend metrics because, over the past decade, technology stocks have maintained some of the lowest dividend yields of any S&P 500 sector (Figure 9). As the market-cap weight of these low-yielding tech titans expanded, the overall index price detached from its historical dividend anchor.
Figure 8: Tech stocks have far outdistanced every other sector over the past decade

Source: Bloomberg Professional (IXT1, IX|1, IXY1, XAS1, IXA1, XAS1, IXD1, IXP1, IXC1, IXR1, XAS1) – Past performance is not indicative of future results.
Figure 9: Tech stocks have paid among the lowest dividends in the S&P 500

Source: Bloomberg Professional TRA (SCOND, SINFT, S5HLTH, SINDU, S5FINL, S5MATR, S5TELS, S5CONS, S5RLST, S5UTIL, S5ENRS) – Past performance is not indicative of future results.
A parallel dynamic has driven small-cap equities. Among Russell 2000 companies, technology stocks have outpaced the broader index while continuing to distribute far less cash to shareholders than the index average (Figure 10). Since April 2022, the Russell 2000 Technology Index has risen by 76%, easily eclipsing the 46% gain achieved by the benchmark Russell 2000 index. During that time the Russell 2000 Index as a whole paid dividends of 1.58% per annum while the Russell 2000 Index Technology had dividends of just 0.2% per annum.
Figure 10: Small-cap tech stocks have outperformed the broader Russell 2000

Source: Bloomberg Professional (RTY and RGUSTS) – Past performance is not indicative of future results.
The divergence between surging equity benchmarks and comparatively stagnant dividend expectations highlights the dual nature of holding the S&P 500, Nasdaq 100 and Russell 2000. On one hand, the price indices have transformed into concentrated expressions of asset-light, tech-driven growth, where infinite-duration earnings expectations overwhelm the gravitational pull of a higher SOFR discount curve. On the other hand, the annual dividend futures market continues to price these indices as if they were traditional, old-economy baskets bound by rigid payout constraints. Either equity index valuations have become fundamentally overextended on AI-driven optimism, or the dividend futures market is suffering from a severe structural under-pricing of corporate resilience as per our previous paper on the subject.
With aggregate corporate profit shares near historic highs (Figure 11) and mega-cap technology titans increasingly initiating—rather than avoiding—shareholder distributions, this stark disconnect raises several critical questions for asset allocators:
- What sort of risk-reward opportunity do dividend index futures represent at these valuation levels? If current pricing reflects an overly pessimistic macro scenario that is decoupled from actual corporate payout behavior, could dividend index futures be fundamentally underpriced relative to their underlying fundamentals?
- How might dividend futures behave in the event of a broader equity market decline? Given the resiliency of past corporate payouts—frequently migrating toward core earnings power rather than mimicking volatile shifts in equity market sentiment—could the front end of the dividend curve offer a structural buffer during a period of multiple compression? During the global financial crisis, for example, dividend payouts fell by only 20% (Figure 12) while the S&P fell by nearly 60% from peak to trough. For the Nasdaq 100, dividend payments hardly fell at all during the global financial crisis (Figure 13).
- Is the current discount a true forecast of corporate decline, or is it a harvestable risk premium? If the steep discount in the forward curve is driven by the involuntary hedging flows of structured product desks rather than fundamental economic consensus, does stepping into the long side of these contracts represent a structurally insulated entry point into the cash-generating engine of the corporations that compose the S&P 500, Nasdaq 100 and the Russell 2000?
While it is impossible to predict the outcome today, the coming years will likely provide the answer as the tension between a potentially overextended equity market and a potentially underpriced dividend curve inevitably resolves itself.
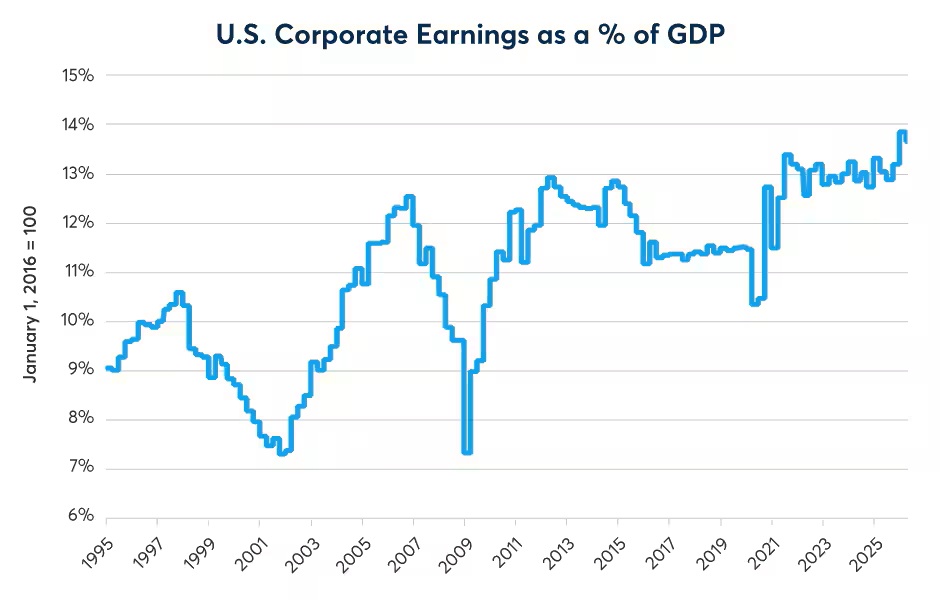
Source: Bloomberg Professional (CPFTTOT and GDP CUR$) – Past performance is not indicative of future results.
Figure 12: During the global financial crisis, dividend payments fell by only 20%

Source: Bloomberg Professional (SPXDIVAN, ASDZ26-35, USGGT10YR, USGG10YR, CPI INDEX and SPX), CME Economic Research Calculations – Past performance is not indicative of future results.
Figure 13: NASDAQ 100 dividends barely changed during the global financial crisis
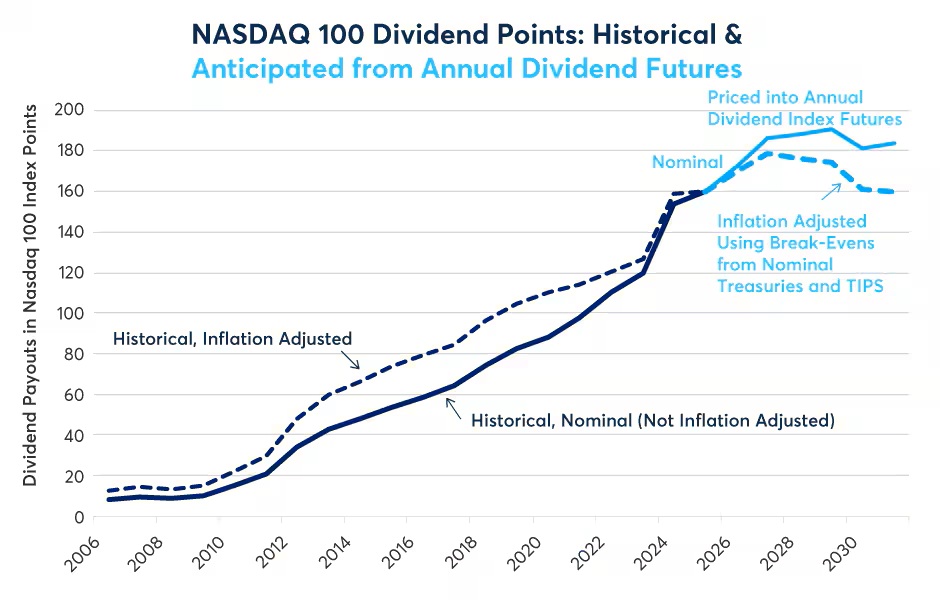
Source: Bloomberg Professional (NDXDIV, ODLZ26-31, USGGT10YR, USGG10YR, CPI INDEX and SPX), CME Economic Research Calculations – Past performance is not indicative of future results.
Erik Norland, Managing Director and Chief Economist, CME Group
is responsible for generating economic analysis on global financial markets by identifying emerging trends, evaluating economic factors and forecasting their potential impact on CME Group’s various asset classes, ranging from interest rate products to energy and agriculture. He is also one of CME Group’s spokespeople on global economic, financial and geopolitical developments.
All examples in this report are hypothetical interpretations of situations and are used for explanation purposes only. The views in this report reflect solely those of the author and not necessarily those of CME Group or its affiliated institutions. This report and the information herein should not be considered investment advice or the results of actual market experience.
Disclosure: CME Group
© [2023] CME Group Inc. All rights reserved. This information is reproduced by permission of CME Group Inc. and its affiliates under license. CME Group Inc. and its affiliates accept no liability or responsibility for the information contained herein, including but not limited to the currency, accuracy and/or completeness of this information, and delays, interruptions, errors or omissions. This information is an unofficial copy and may not reflect the official and accurate version. For the definitive and up-to-date version of any of this information, please see cmegroup.com.
Disclosure: Interactive Brokers Third Party
Information posted on IBKR Campus that is provided by third-parties does NOT constitute a recommendation that you should contract for the services of that third party. Third-party participants who contribute to IBKR Campus are independent of Interactive Brokers and Interactive Brokers does not make any representations or warranties concerning the services offered, their past or future performance, or the accuracy of the information provided by the third party. Past performance is no guarantee of future results.
This material is from CME Group and is being posted with its permission. The views expressed in this material are solely those of the author and/or CME Group and Interactive Brokers is not endorsing or recommending any investment or trading discussed in the material. This material is not and should not be construed as an offer to buy or sell any security. It should not be construed as research or investment advice or a recommendation to buy, sell or hold any security or commodity. This material does not and is not intended to take into account the particular financial conditions, investment objectives or requirements of individual customers. Before acting on this material, you should consider whether it is suitable for your particular circumstances and, as necessary, seek professional advice.






Join The Conversation
If you have a general question, it may already be covered in our FAQs page. go to: IBKR Ireland FAQs or IBKR U.K. FAQs. If you have an account-specific question or concern, please reach out to Client Services: IBKR Ireland or IBKR U.K..
Visit IBKR U.K. Open an IBKR U.K. Account