


Recent positioning data in crude oil futures, combined with sentiment and technical indicators, may be offering valuable insight into how market participants are interpreting the current price environment. By analyzing Commitments of Traders (COT) data alongside overbought/oversold conditions and volume dynamics, investors can gain a more comprehensive view of potential risks and opportunities in the oil market.
Understanding the COT Report and Producer Positioning
The Commitments of Traders (COT) report, published weekly by the U.S. Commodity Futures Trading Commission (CFTC), provides transparency into how different categories of futures market participants are positioned.
Among these categories, producers and merchants—entities directly involved in extracting, refining, or processing crude oil—are often closely monitored. Because of their commercial exposure, these participants frequently use futures contracts to hedge against adverse price movements rather than to speculate.
Historically, crude oil producers have tended to hold net short futures positions, reflecting their need to protect revenues from potential declines in oil prices. By selling futures, they lock in prices for future production.
However, positioning trends have not been static.
A Behavioral Shift Since 2021
Beginning around 2021, producer positioning began to shift. Instead of maintaining predominantly short exposure, producers increasingly accumulated net long positions in crude oil futures.
This change suggested that, beyond hedging, commercial participants may have viewed oil prices as relatively undervalued. The trend became more visible through 2023 and into 2024, when crude traded at comparatively lower price levels.
While COT data does not reveal motivations, shifts in commercial positioning can sometimes reflect evolving expectations about supply, demand, or production economics.
Recent Developments: Long Positions Declining
In recent weeks, however, positioning data has begun to change again.
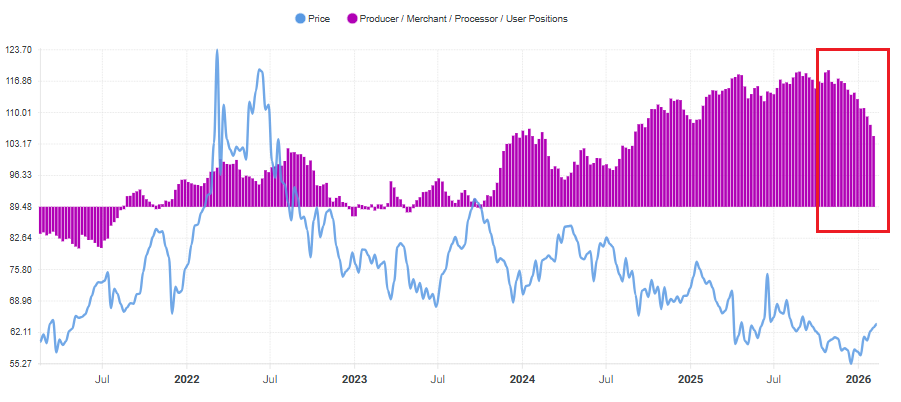
Net positions among producers have started to decline, driven largely by a reduction in long exposure rather than a surge in new shorts. When analyzed separately, gross long positions show signs of being scaled back.
This development is notable because it contrasts with the accumulation behavior seen during prior price weakness. A reduction in long hedges or speculative longs from commercial players may indicate a more cautious outlook toward future price appreciation.
It is important to stress that COT data is descriptive, not predictive. It reflects positioning—not certainty about future prices.
Past performance is not indicative of future returns.
Crude oil futures positioning: Net positions of Producers/Merchants/Processors/Users compared with price action. The highlighted area shows a recent decline in net long exposure, driven primarily by a reduction in long positions. Historically, shifts in commercial positioning have coincided with changing expectations around supply, demand, and price risk in the oil market. Source: Forecaster.biz Crude oil COT Report
Overbought Signals Emerging
Overbought and oversold frameworks are designed to assess whether price movements have stretched beyond their typical statistical ranges. Rather than predicting reversals, these indicators help contextualize how extended a trend may be from a momentum and sentiment perspective.
Based on current readings, crude oil is now approaching overbought territory. This type of environment often develops after a rebound phase, when improving price action begins to attract renewed market attention. As bullish narratives gain visibility, participation can broaden—sometimes drawing in late buyers motivated by fear of missing further upside.
From a behavioral standpoint, overbought conditions may also coincide with signs of momentum fatigue. As prices rise, the pool of incremental buyers can begin to thin, increasing the likelihood of consolidation or short-term cooling phases.
Importantly, overbought does not mean prices must reverse immediately. Markets can remain extended for prolonged periods, particularly when supported by strong fundamental catalysts. However, historically, similar sentiment and momentum configurations have frequently aligned with periods where upside progression slows and local tops begin to form.

Past performance is not indicative of future returns.
Crude oil overbought/oversold framework: The Advanced DPO and Market Mood Meter indicators highlight recent overbought conditions. The highlighted area shows sentiment and momentum readings approaching historically elevated zones, which have previously coincided with periods of price consolidation or potential short-term tops. These signals are indicative, not predictive, and should be interpreted alongside broader market analysis. Source: Forecaster Terminal.
The Role of Volume in Identifying Turning Points
Volume analysis can add another layer of context.
Spikes in trading volume often accompany:
- Market tops (distribution phases)
- Market bottoms (capitulation phases)
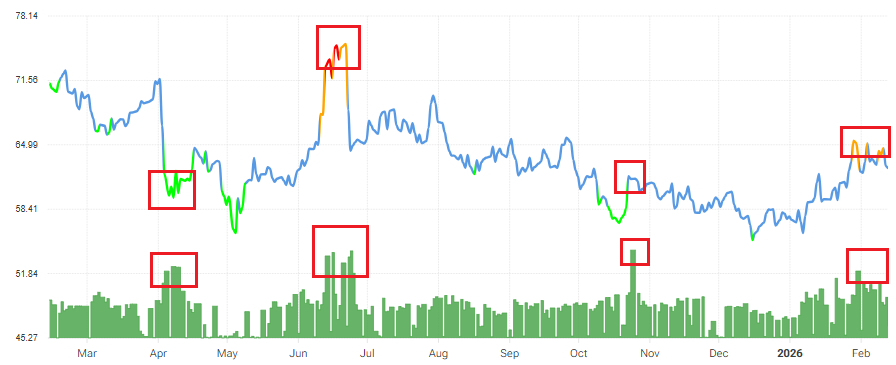
Recent oil price action has shown volume expansion near local highs. In prior instances, similar volume peaks have aligned with turning points in price trends.
Past performance is not indicative of future returns.
Crude oil price and volume dynamics: The highlighted areas show notable spikes in trading volume occurring near local highs and lows.
One pattern sometimes observed is:
- A volume spike at a price extreme
- A retest of the level on lower volume
Technicians often interpret this as a sign that the initial move exhausted buying or selling pressure.
Again, such patterns are probabilistic, not deterministic.
Building a Multi-Layer Market View
When analyzing crude oil, relying on a single dataset rarely provides a complete picture. Futures positioning, sentiment indicators, price structure, and macroeconomic drivers each offer partial insight, but it is their combined interpretation that can help investors form a more balanced view of market conditions.
Recent Commitments of Traders data shows a meaningful shift in commercial positioning. After several years in which producers had accumulated notable long exposure—suggesting they viewed prices as relatively undervalued—there has been a visible reduction in those long positions in recent weeks. This change is particularly noteworthy given the historical tendency of producers to maintain structurally short hedges.
At the same time, price action has moved modestly higher from recent lows, yet momentum and sentiment indicators are now reflecting overbought conditions. From a behavioral standpoint, such environments often emerge when bullish narratives gain traction and late buyers enter the market.
Volume analysis adds another layer of context. Spikes in trading activity have appeared near recent price highs—patterns that, in past cycles, have sometimes aligned with phases of trend exhaustion rather than continuation.
When these elements are assessed together—commercial positioning becoming less supportive, sentiment reaching elevated levels, and volume expanding into strength—the combined signal may point to a market that is vulnerable to a period of price softening.
While no single indicator can confirm direction, the alignment of these factors leads us to adopt a more cautious stance in the near term, with the risk that crude oil prices could face downward pressure should current conditions persist.
—
Originally Posted on February 16, 2026
Disclosure: Interactive Brokers Third Party
Information posted on IBKR Campus that is provided by third-parties does NOT constitute a recommendation that you should contract for the services of that third party. Third-party participants who contribute to IBKR Campus are independent of Interactive Brokers and Interactive Brokers does not make any representations or warranties concerning the services offered, their past or future performance, or the accuracy of the information provided by the third party. Past performance is no guarantee of future results.
This material is from Forecaster.biz and is being posted with its permission. The views expressed in this material are solely those of the author and/or Forecaster.biz and Interactive Brokers is not endorsing or recommending any investment or trading discussed in the material. This material is not and should not be construed as an offer to buy or sell any security. It should not be construed as research or investment advice or a recommendation to buy, sell or hold any security or commodity. This material does not and is not intended to take into account the particular financial conditions, investment objectives or requirements of individual customers. Before acting on this material, you should consider whether it is suitable for your particular circumstances and, as necessary, seek professional advice.
Disclosure: Futures Trading
Futures are not suitable for all investors. The amount you may lose may be greater than your initial investment. Before trading futures, please read the CFTC Risk Disclosure. A copy and additional information are available at the Warnings and Disclosures section of your local Interactive Brokers website.


")


Join The Conversation
If you have a general question, it may already be covered in our FAQs page. go to: IBKR Ireland FAQs or IBKR U.K. FAQs. If you have an account-specific question or concern, please reach out to Client Services: IBKR Ireland or IBKR U.K..
Visit IBKR U.K. Open an IBKR U.K. Account