


It is no secret that markets have become quite sensitive to gyrations in oil futures markets since the outbreak of hostilities in the Persian Gulf. There are several obvious reasons for the inverse relationship between the price of crude, the S&P 500 (SPX), and 10-year Treasury yields. Not surprisingly, bonds, whose traders often have a better handle on the effects of geopolitical events on their markets than their equity counterparts, established their relationship about a week faster than SPX did.
It is no secret that algorithmic trading plays a significant role in the intraday activity of a wide range of financial markets, and that role arguably increases when volatility increases. Market makers are reliant upon algorithms to power their models that maintain pricing discipline while posting continuous two-sided prices in thousands of products throughout the trading day. (This obligation differentiates them from other professional and semi-professional traders, many of whom might also employ algorithms, but who have the option of declining to post prices when conditions become disjointed or murky.) As a result, they continually are in search of external signals – preferably from other liquid markets – that demonstrably influence the prices of the items they trade. While those signals can be faint and prone to change in the short- and medium-term, sometimes they are glaringly obvious. Oil is that glaringly obvious factor right now.
The current inverse intraday relationship between SPX and WTI crude futures (CL) is apparent in the 1-week chart below. It’s not perfect – no relationship of this type is – but it is quite robust.
1-Week, CL April 2026 Futures (red/green candles, right scale), SPX (blue line, left)
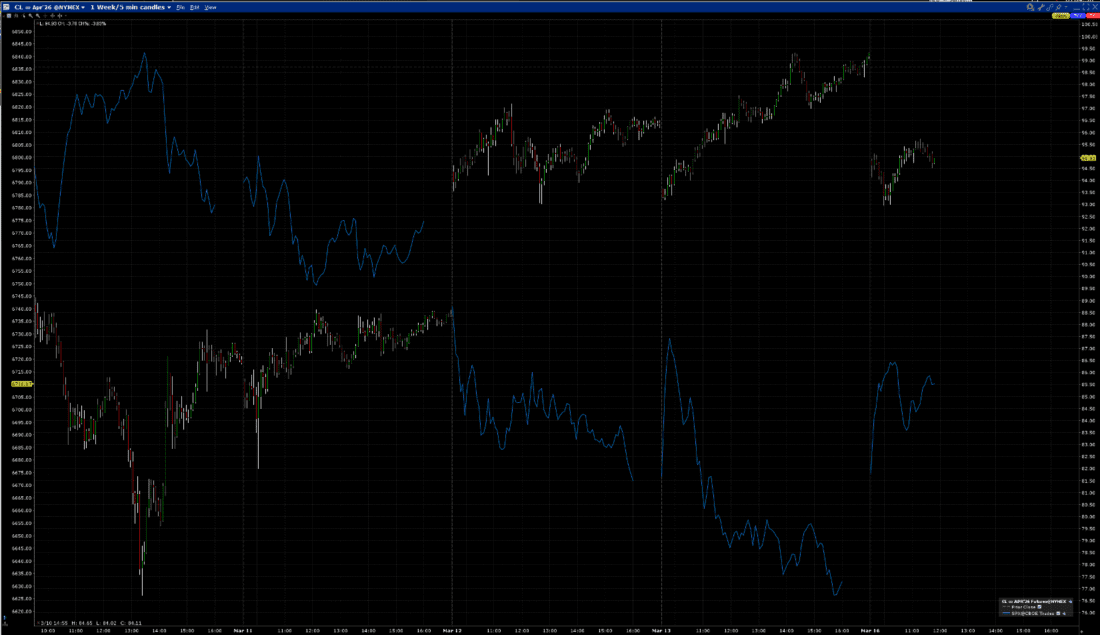
Source: Interactive Brokers, past performance is not indicative of future returns.
Yet when we look back at the price action since the start of the conflict on Saturday, February 28th, we see that stocks originally tried to shrug off the deleterious impact of higher oil prices even as bonds reacted almost immediately. It wasn’t until nearly a week had passed, Friday, March 6th, that stocks began to track oil in earnest. The graph below shows inverted moves in 10-Year Treasury futures (ZN) and ES futures versus CL. Looking at ZN on an inverted basis can be intuitive, since bond yields move inversely with their prices, but it might take a bit of time to adjust oneself to looking at stock indices “upside down”, though it does reinforce the inverse correlation.
11-Days, CL (white/blue 10-minute candles, inner right scale, with 30 period average, green), Inverted ES futures (red line, outer right scale), Inverted Treasury 10-Year Futures (purple line, left scale)
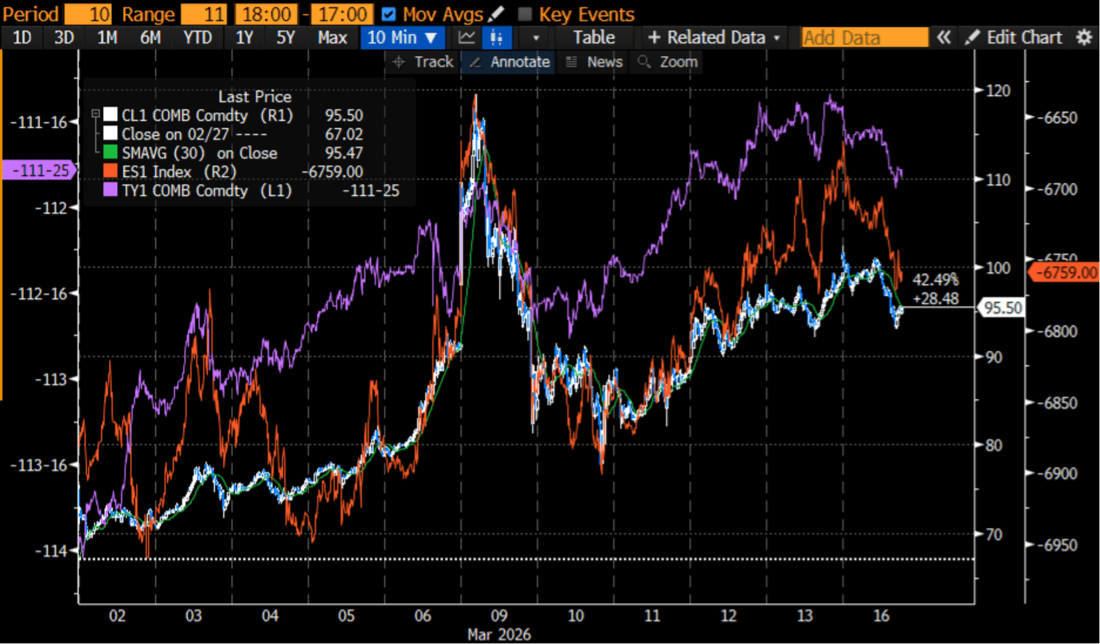
Source: Bloomberg, past performance is not indicative of future returns.
Stocks reacted relatively well during the first few days of the conflict, rising very slightly on Monday, March 2nd, and alternating up and down days for the next two. The initial reaction was understandable under the circumstances. Equity investors have become conditioned to seeing military forays as being buying opportunities, since the prior examples have tended to resolve themselves quickly and involved countries that are less economically significant than Iran. Even though that country has been divorced from Western economies for some time, Iran’s influence over a key choke point for global oil transit clearly has greater ramifications than, say, the operation in Venezuela, which had only temporary and limited impact.
It took stock traders a bit longer to recognize that the standard dip-buying, rally-chasing playbook that worked so well in a wide variety of situations was not well adapted to the current one. We’ve often asserted that commodity and bond traders were more clear-eyed in the face of geopolitical events, and so far this has proved to be the case.
By the way, stock traders DO like Mondays. Besides responding justifiably well to a modest dip in crude prices today, some of the enthusiasm could be related to the day of the week. SPX has only fallen once on a Monday so far this year, when it dipped by 1.04% on February 23rd. (The two times when the trading week started on Tuesday were mixed — +0.1% on February 17th, and -2.06% on January 20th). Speaking of tradable patterns, 8 out of 9 is a pretty good track record.

Past performance is not indicative of future returns.
New to Interactive Brokers?
Open AccountAlready an Interactive Brokers Client?
Request Trading PermissionDisclosure: Interactive Brokers
The analysis in this material is provided for information only and is not and should not be construed as an offer to sell or the solicitation of an offer to buy any security. To the extent that this material discusses general market activity, industry or sector trends or other broad-based economic or political conditions, it should not be construed as research or investment advice. To the extent that it includes references to specific securities, commodities, currencies, or other instruments, those references do not constitute a recommendation by IBKR to buy, sell or hold such investments. This material does not and is not intended to take into account the particular financial conditions, investment objectives or requirements of individual customers. Before acting on this material, you should consider whether it is suitable for your particular circumstances and, as necessary, seek professional advice.
The views and opinions expressed herein are those of the author and do not necessarily reflect the views of Interactive Brokers, its affiliates, or its employees.
Disclosure: Futures Trading
Futures are not suitable for all investors. The amount you may lose may be greater than your initial investment. Before trading futures, please read the CFTC Risk Disclosure. A copy and additional information are available at the Warnings and Disclosures section of your local Interactive Brokers website.


Join The Conversation
If you have a general question, it may already be covered in our FAQs page. go to: IBKR Ireland FAQs or IBKR U.K. FAQs. If you have an account-specific question or concern, please reach out to Client Services: IBKR Ireland or IBKR U.K..
Visit IBKR U.K. Open an IBKR U.K. Account