


Key Takeaways
- Tariff rates have risen sharply, but U.S. companies — and the U.S. economy — have proven more resilient than many investors feared.
- Tariff pass-through takes time, and survey data suggests that U.S. companies may be poised to shift more of the burden to consumers. The full impact of tariffs remains to be seen.
- Strong growth and greater pricing power makes us prefer U.S. equities, but we also see room for inflation protection and geographic diversification in the new trade regime.
Tariffs have dominated headlines — and market movements — for much of the year. While we believe peak policy uncertainty is almost certainly behind us, October brought potential new tariff announcements after China took actions relating to rare earths. Clearly, trade policy remains complex and will continue to evolve. Against this uncertain backdrop, we examine what impact tariffs had in the first six months since the Trump administration rolled out sweeping changes to trade policy, what remains to be seen, and what it may mean for portfolios.
THE FIRST 180 DAYS: HOW TARIFFS HAVE SHIFTED
The average effective tariff rate in the U.S. stands at 17%, up from just 2.4% at the start of the year.1 But the increase in tariff rates has not been uniform across goods, countries, or time. After announcing sharply higher tariff rates for much of the world in April, the U.S. administration put a 90-day pause on implementation.2 Since then, many deals have been struck that have established new rates, select exemptions, and in some instances delays in implementation. What’s more, a spate of lawsuits challenging the legality of a subset of the tariffs continues to wind its way through the courts. While we have seen stabilization in trade policy since April, it’s clear the situation remains fluid.
Figure 1: Current tariff rates for select trading partners/industries, and when they came into effect
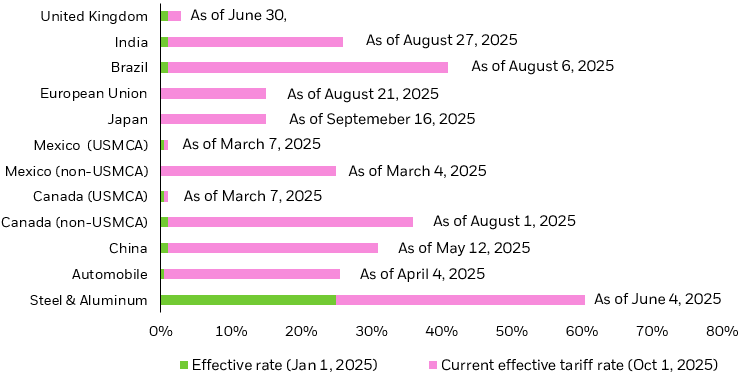
Source: Congressional Research Services and HBS Pricing Lab as of October 10, 2025.
TARIFFS 2025: WHAT DO WE KNOW NOW?
Revenue — While it may still be early days for the tariffs, we have some evidence of their impact in terms of revenue generated for the government. The Daily Treasury Statement shows that since tariffs were announced in April, cumulative customs and excise tax revenue has run about $88 billion higher vs the same period in 2024.3 Additional revenue can be used to offset government spending elsewhere, a potential boon to federal finances. However, with the federal deficit running at nearly $2 trillion in 20254, we feel the impact is likely to be modest, absent further changes.
Payment — Who ultimately pays for tariffs? This remains the most important question for many investors. At the end of June, Goldman Sachs and BNP Paribas separately estimated that U.S. firms had absorbed around 60% of the total cost of tariffs, with foreign firms and U.S. consumers absorbing a further 20% each. But as the situation evolves, we believe those early estimates are likely to change (more below).
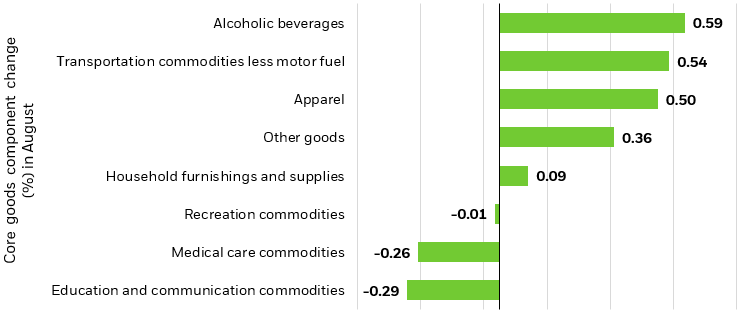
Inflation — While perhaps not as large or as fast as some market participants anticipated, we see some evidence of higher tariffs in inflation reports. Parts of the CPI basket that are highly exposed to supply chains in some of the highest-tariffed regions, such as apparel, furniture, and sporting goods, have seen prices rise in recent months. And there may be evidence of indirect effects as well. As we learned during the pandemic, consumers who are unable to spend on services may pivot to goods; we feel the same effect is likely happening to some extent in reverse, as consumers put off by higher tariffs have pivoted to services, with evidence of such substitution found in higher concert, dining, and lodging prices.5 Still, we have not seen future inflation expectations become unanchored, and the acceleration in inflation from the summer was not enough to prevent the Federal Reserve from resuming rate cuts in September and October.
Figure 2: Evidence of tariff pass-through in core goods
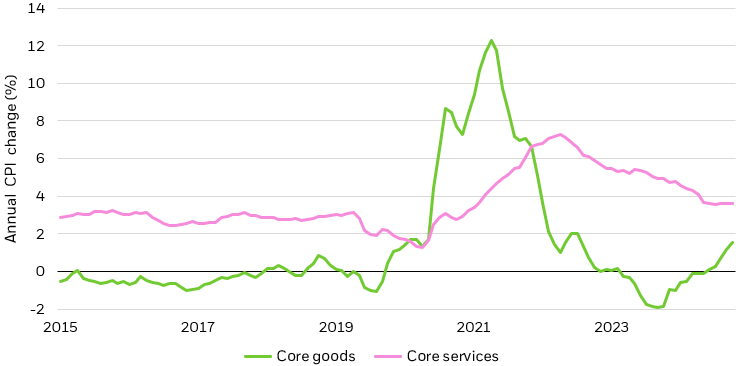
Source: BlackRock, Bloomberg, U.S. Bureau of Labor Statistics, core goods and core services as represented by CPI inflation. As of Sept. 15, 2025. Bottom chart represent MoM percentage change from July to August 2025.
Growth — All told, U.S. companies — and indeed the U.S. economy — have proven remarkably more resilient than many investors expected. Second quarter earnings handily beat low expectations, delivering 12% year-over-year growth compared to the 4% forecasted by analysts.6 And while GDP growth was negative in Q1 as companies and individuals pulled forward import purchases ahead of expected tariffs, Q2 GDP figures surprised to the upside, only to be further revised higher.7 Though the full economic impact of the tariffs cannot yet be determined cannot be determined thus far (more below), we have avoided the worst-case scenarios some observers initially projected.
Figure 3: GDP rebounded after Q1’s decline
Contributions to U.S. GDP, quarter-over-quarter change
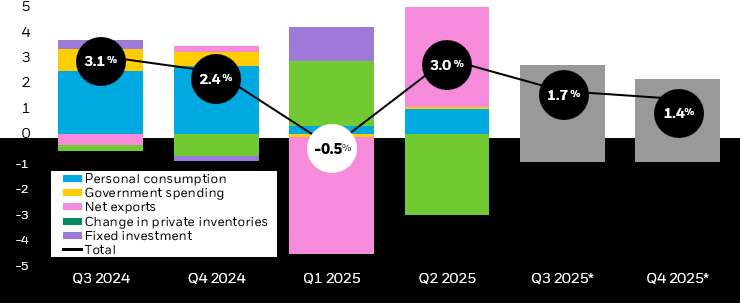
Source: Bloomberg, as of October 16, 2025. * Q3 and Q4 2025 data estimates according to Bloomberg. Past performance does not guarantee future results. Forward looking estimates may not come to pass.
TARIFFS 2025 & BEYOND: WHAT ARE WE STILL WATCHING FOR?
Tariff pass-through is likely to take time. U.S. firms tend to keep a few weeks to several months’ worth of inventory on hand, though this varies by industry.8 That means that tariffs that went into effect in August may only show up in September or October accounting, which itself is often reported on a quarterly lag. Beyond delays due to inventory, we believe many companies may have held off passing higher input costs to consumers as uncertainty around trade policy and the economy remained high. But signs of a stronger consumer and economy evident in September’s economic data, and more certainty that tariffs are here to stay, may spur companies to shift more of the burden to their customers.
While many firms have reported taking the brunt of the financial hit from tariffs so far, the patterns we find in the survey responses suggest that as firms come to believe that the new tariffs are likely to endure, they will implement more price hikes, resulting in a greater impact on consumer prices.9
Earlier in the tariff cycle, U.S. businesses absorbed most of the costs. More recent estimates indicate that the balance is shifting, with consumers now expected to bear a majority of total tariff costs, around 55% as the effects of recent trade measures continue to filter through. Meanwhile, the share absorbed by businesses has declined to roughly 22% as firms pass on higher input costs.10 What’s more, tariff rates on China, India, computer chips, and semiconductors are still being negotiated. Tariffs on specific goods, such as those that recently went into effect on lumber and wood products in October, have yet to appear in the data. And new tariffs were still being announced. We expect the impact of tariffs to continue to evolve in the quarters, and perhaps years ahead.
WHAT DOES TRADE POLICY MEAN FOR PORTFOLIOS?
The stronger-than-expected economy, coupled with forward expectations for greater corporate pricing power, leave us comfortable with U.S. equity risk. But the impacts of tariffs have not been uniform, even within sectors. Third quarter earnings calls will be closely watched for mentions of tariffs and the impact on margins. We favor a systematic approach to seeking winners and losers in affected sectors.
Finally, while we prefer the strong earnings growth and AI tailwind in U.S. large caps, it’s also important to note that broad geographic diversification has benefited many investors, even in a year fraught with geopolitical tensions. One global response to more uncertain U.S. trade policy has been lower demand for dollars, as evidenced by record annual purchases of gold by global central banks, and a 10% decline in the value of the USD.11 A cheaper dollar has propelled many international indexes to outperform domestic ones.12
—
Originally Posted on November 7, 2025 – What tariffs may mean for the economy and portfolios
Disclosure: iShares by BlackRock
The iShares Funds are distributed by BlackRock Investments, LLC (together with its affiliates, “BlackRock”).
The iShares Funds are not sponsored, endorsed, issued, sold or promoted by Markit Indices Limited, nor does this company make any representation regarding the advisability of investing in the Funds. BlackRock is not affiliated with Markit Indices Limited.
©2022 BlackRock, Inc. All rights reserved. iSHARES and BLACKROCK are registered trademarks of BlackRock, Inc., or its subsidiaries in the United States and elsewhere. All other marks are the property of their respective owners.
Disclosure: Interactive Brokers Third Party
Information posted on IBKR Campus that is provided by third-parties does NOT constitute a recommendation that you should contract for the services of that third party. Third-party participants who contribute to IBKR Campus are independent of Interactive Brokers and Interactive Brokers does not make any representations or warranties concerning the services offered, their past or future performance, or the accuracy of the information provided by the third party. Past performance is no guarantee of future results.
This material is from iShares by BlackRock and is being posted with its permission. The views expressed in this material are solely those of the author and/or iShares by BlackRock and Interactive Brokers is not endorsing or recommending any investment or trading discussed in the material. This material is not and should not be construed as an offer to buy or sell any security. It should not be construed as research or investment advice or a recommendation to buy, sell or hold any security or commodity. This material does not and is not intended to take into account the particular financial conditions, investment objectives or requirements of individual customers. Before acting on this material, you should consider whether it is suitable for your particular circumstances and, as necessary, seek professional advice.


")

Join The Conversation
If you have a general question, it may already be covered in our FAQs page. go to: IBKR Ireland FAQs or IBKR U.K. FAQs. If you have an account-specific question or concern, please reach out to Client Services: IBKR Ireland or IBKR U.K..
Visit IBKR U.K. Open an IBKR U.K. Account