


Originally Posted 06 October 2025 – Charting Market Views on Interest Rates With Richard Clarida
Former Federal Reserve Vice Chair Richard Clarida charts key signals for interest rates and the economy – and what they could mean for investors.
Monetary policy walks the inflation tightrope
The balance of risks to the Federal Reserve’s dual mandate (price stability and maximum employment) prompted the central bank to lower its policy rate in September in an effort to bolster the economy and employment. However, U.S. inflation remains above the Fed’s target and is elevated relative to global peers.
We expect additional rate cuts, but not down to the near-zero levels that could rekindle high inflation. Well-anchored inflation expectations likely inform Fed decisions at least as much as current prices and recent trends do. Thus far, tariff-related price pressures do not appear to have significantly affected inflation expectations.
Global core CPI inflation
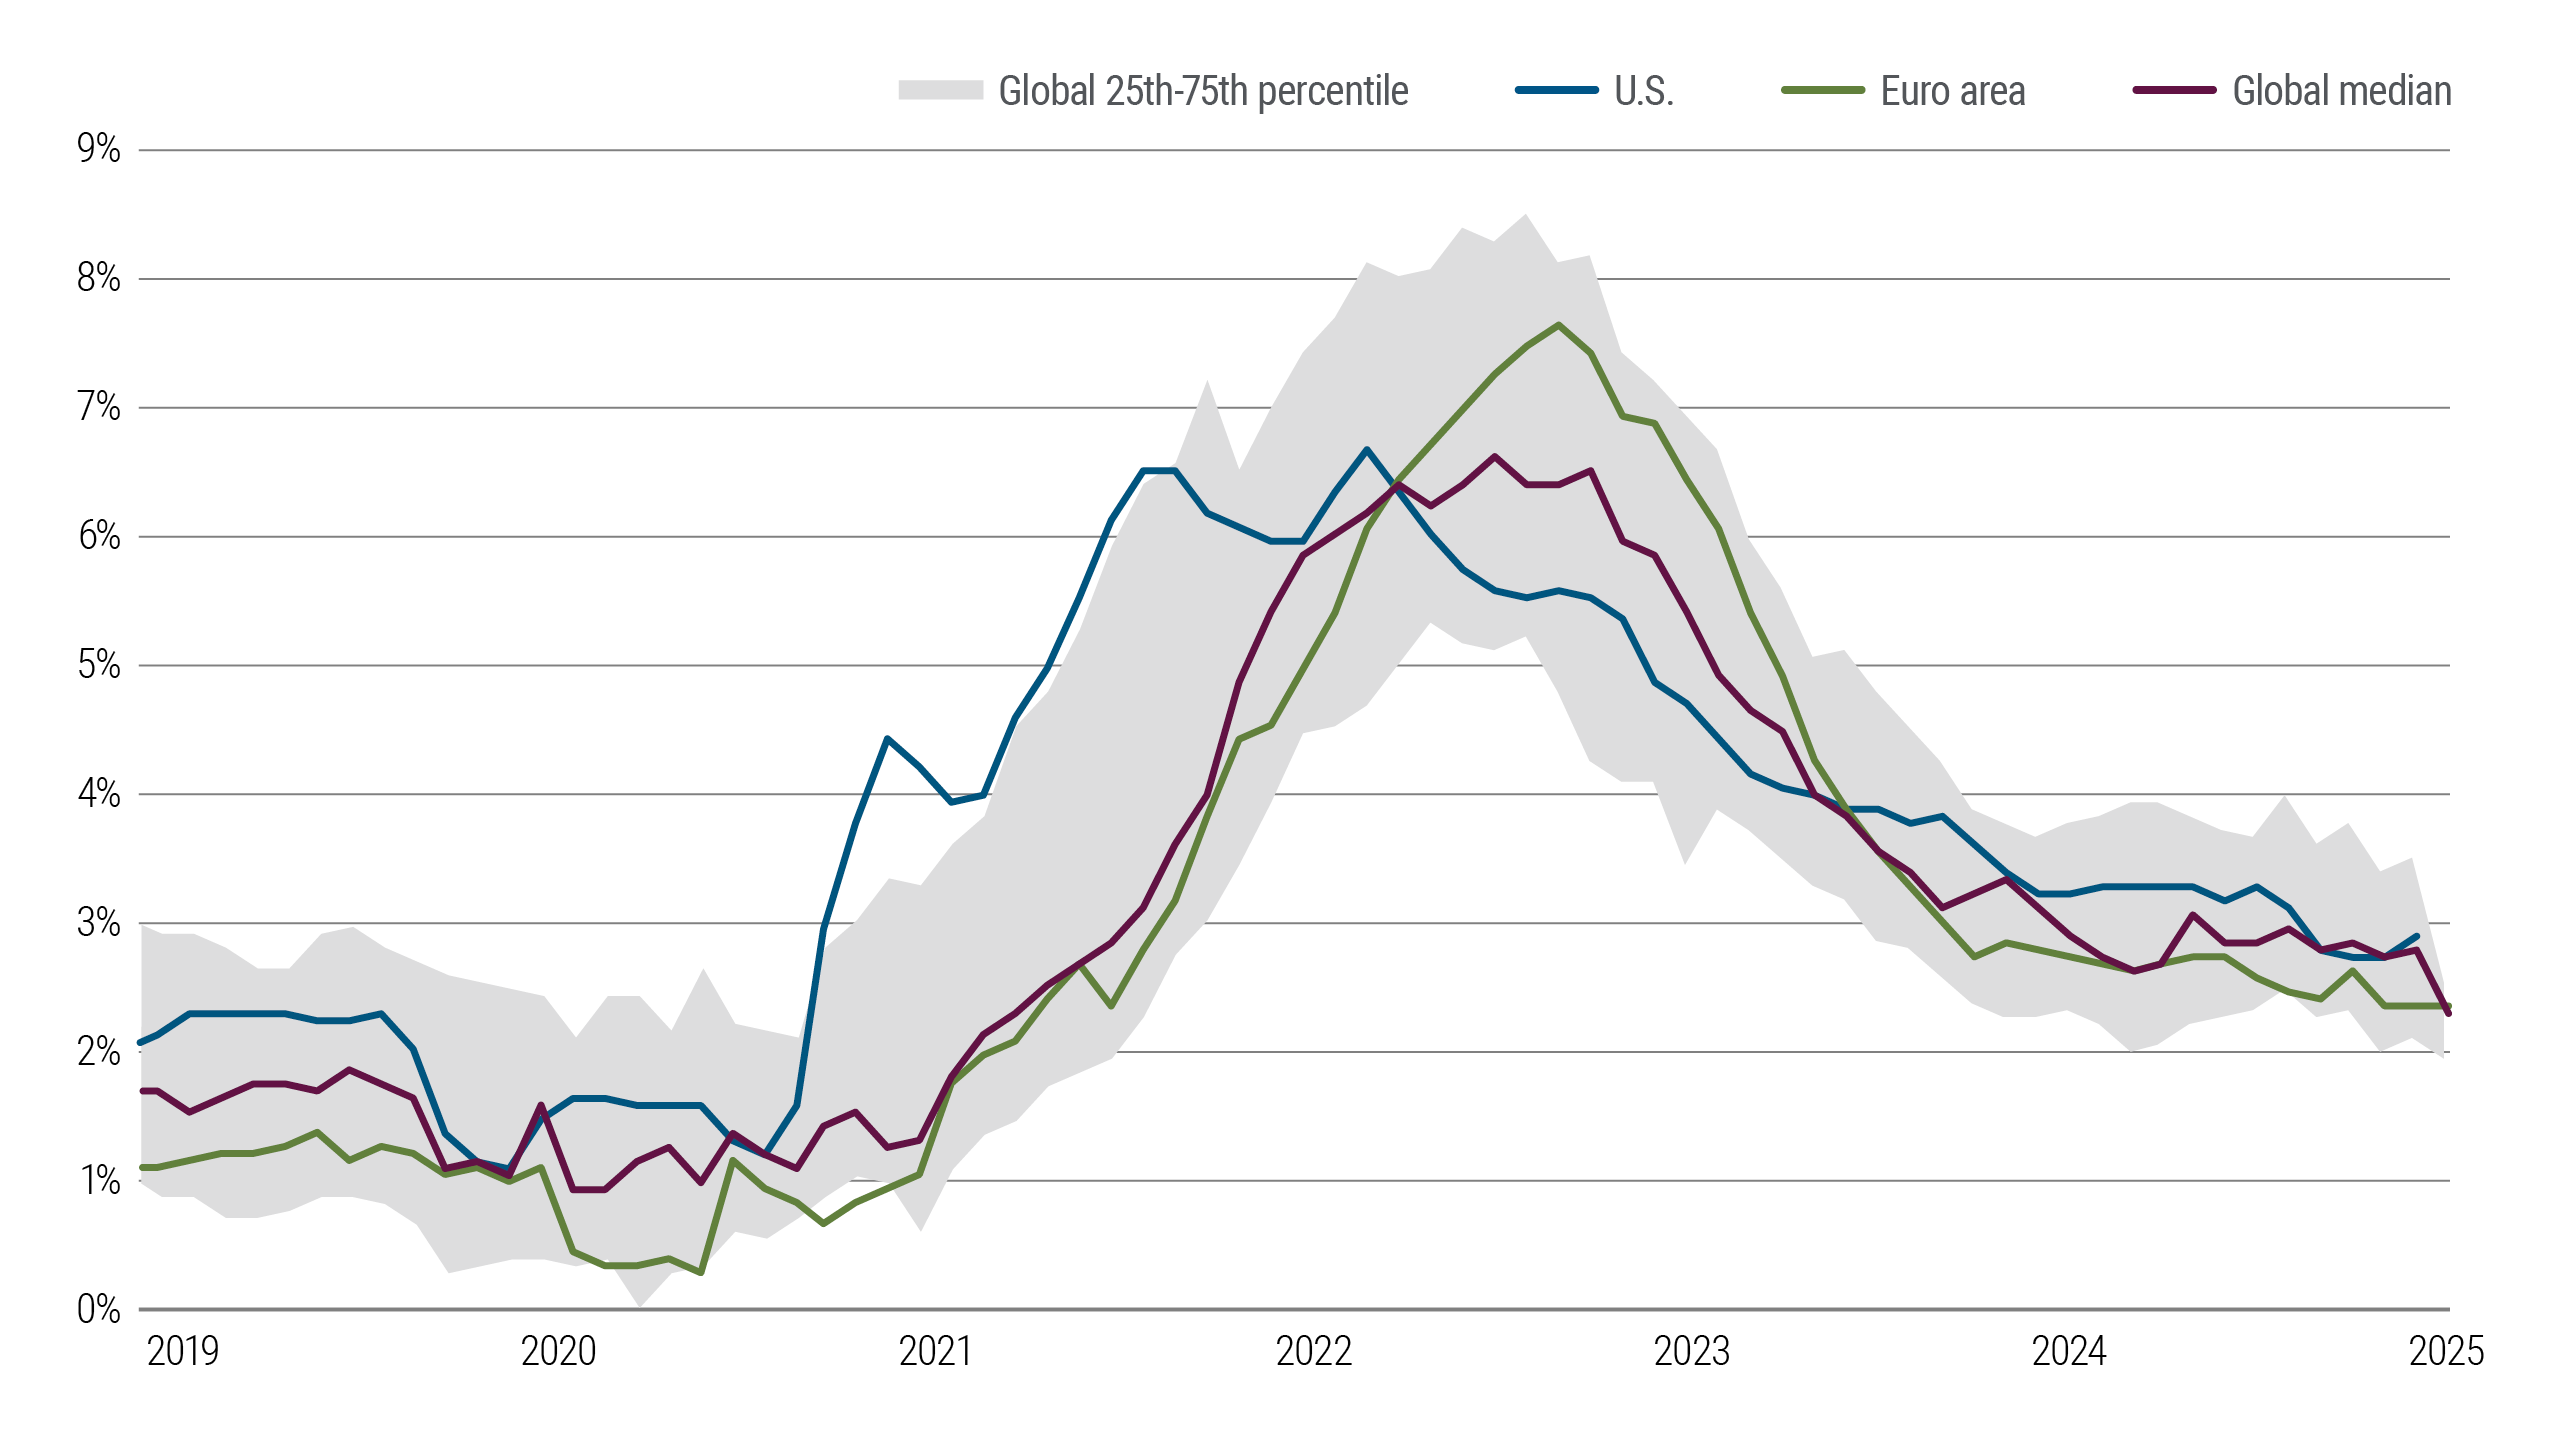
Source: Haver Analytics and PIMCO calculations as of August 2025. For the 25th–75th percentile, the Consumer Price Index (CPI) was used for Australia, Canada, Japan, U.S., China, India, Brazil, South Korea, Mexico, Indonesia, Israel, Turkey, Russia, Egypt, Poland, Philippines, Vietnam, Colombia, Hungary, South Africa, and Thailand. The Harmonized Index of Consumer Prices (HICP) was used for Ireland, Germany, France, Belgium, Finland, Italy, Netherlands, Greece, Norway, Portugal, Spain, Sweden, Switzerland, U.K., and the euro area.
Bullish sentiment has returned to equity markets after a tariff-related dip: Stock prices don’t signal recession, but how much of this is froth?
Indeed, the U.S. equity market has remained both buoyant and bullish, but how much of this is froth?
Nearly 70% of the value of the S&P 500 Index is not represented by those companies’ book value or their earnings forecasts for next three years. This seems to reflect a great deal of trust in the overall strength of large U.S. companies.
This measure dipped in early 2025 following tariff-related turbulence but has since risen back near the exuberant level reached in November 2024 after the U.S. election – and prior to that, in the late 1990s tech bubble.
Percentage of S&P value not represented by book value and next 3 years’ earnings expectations
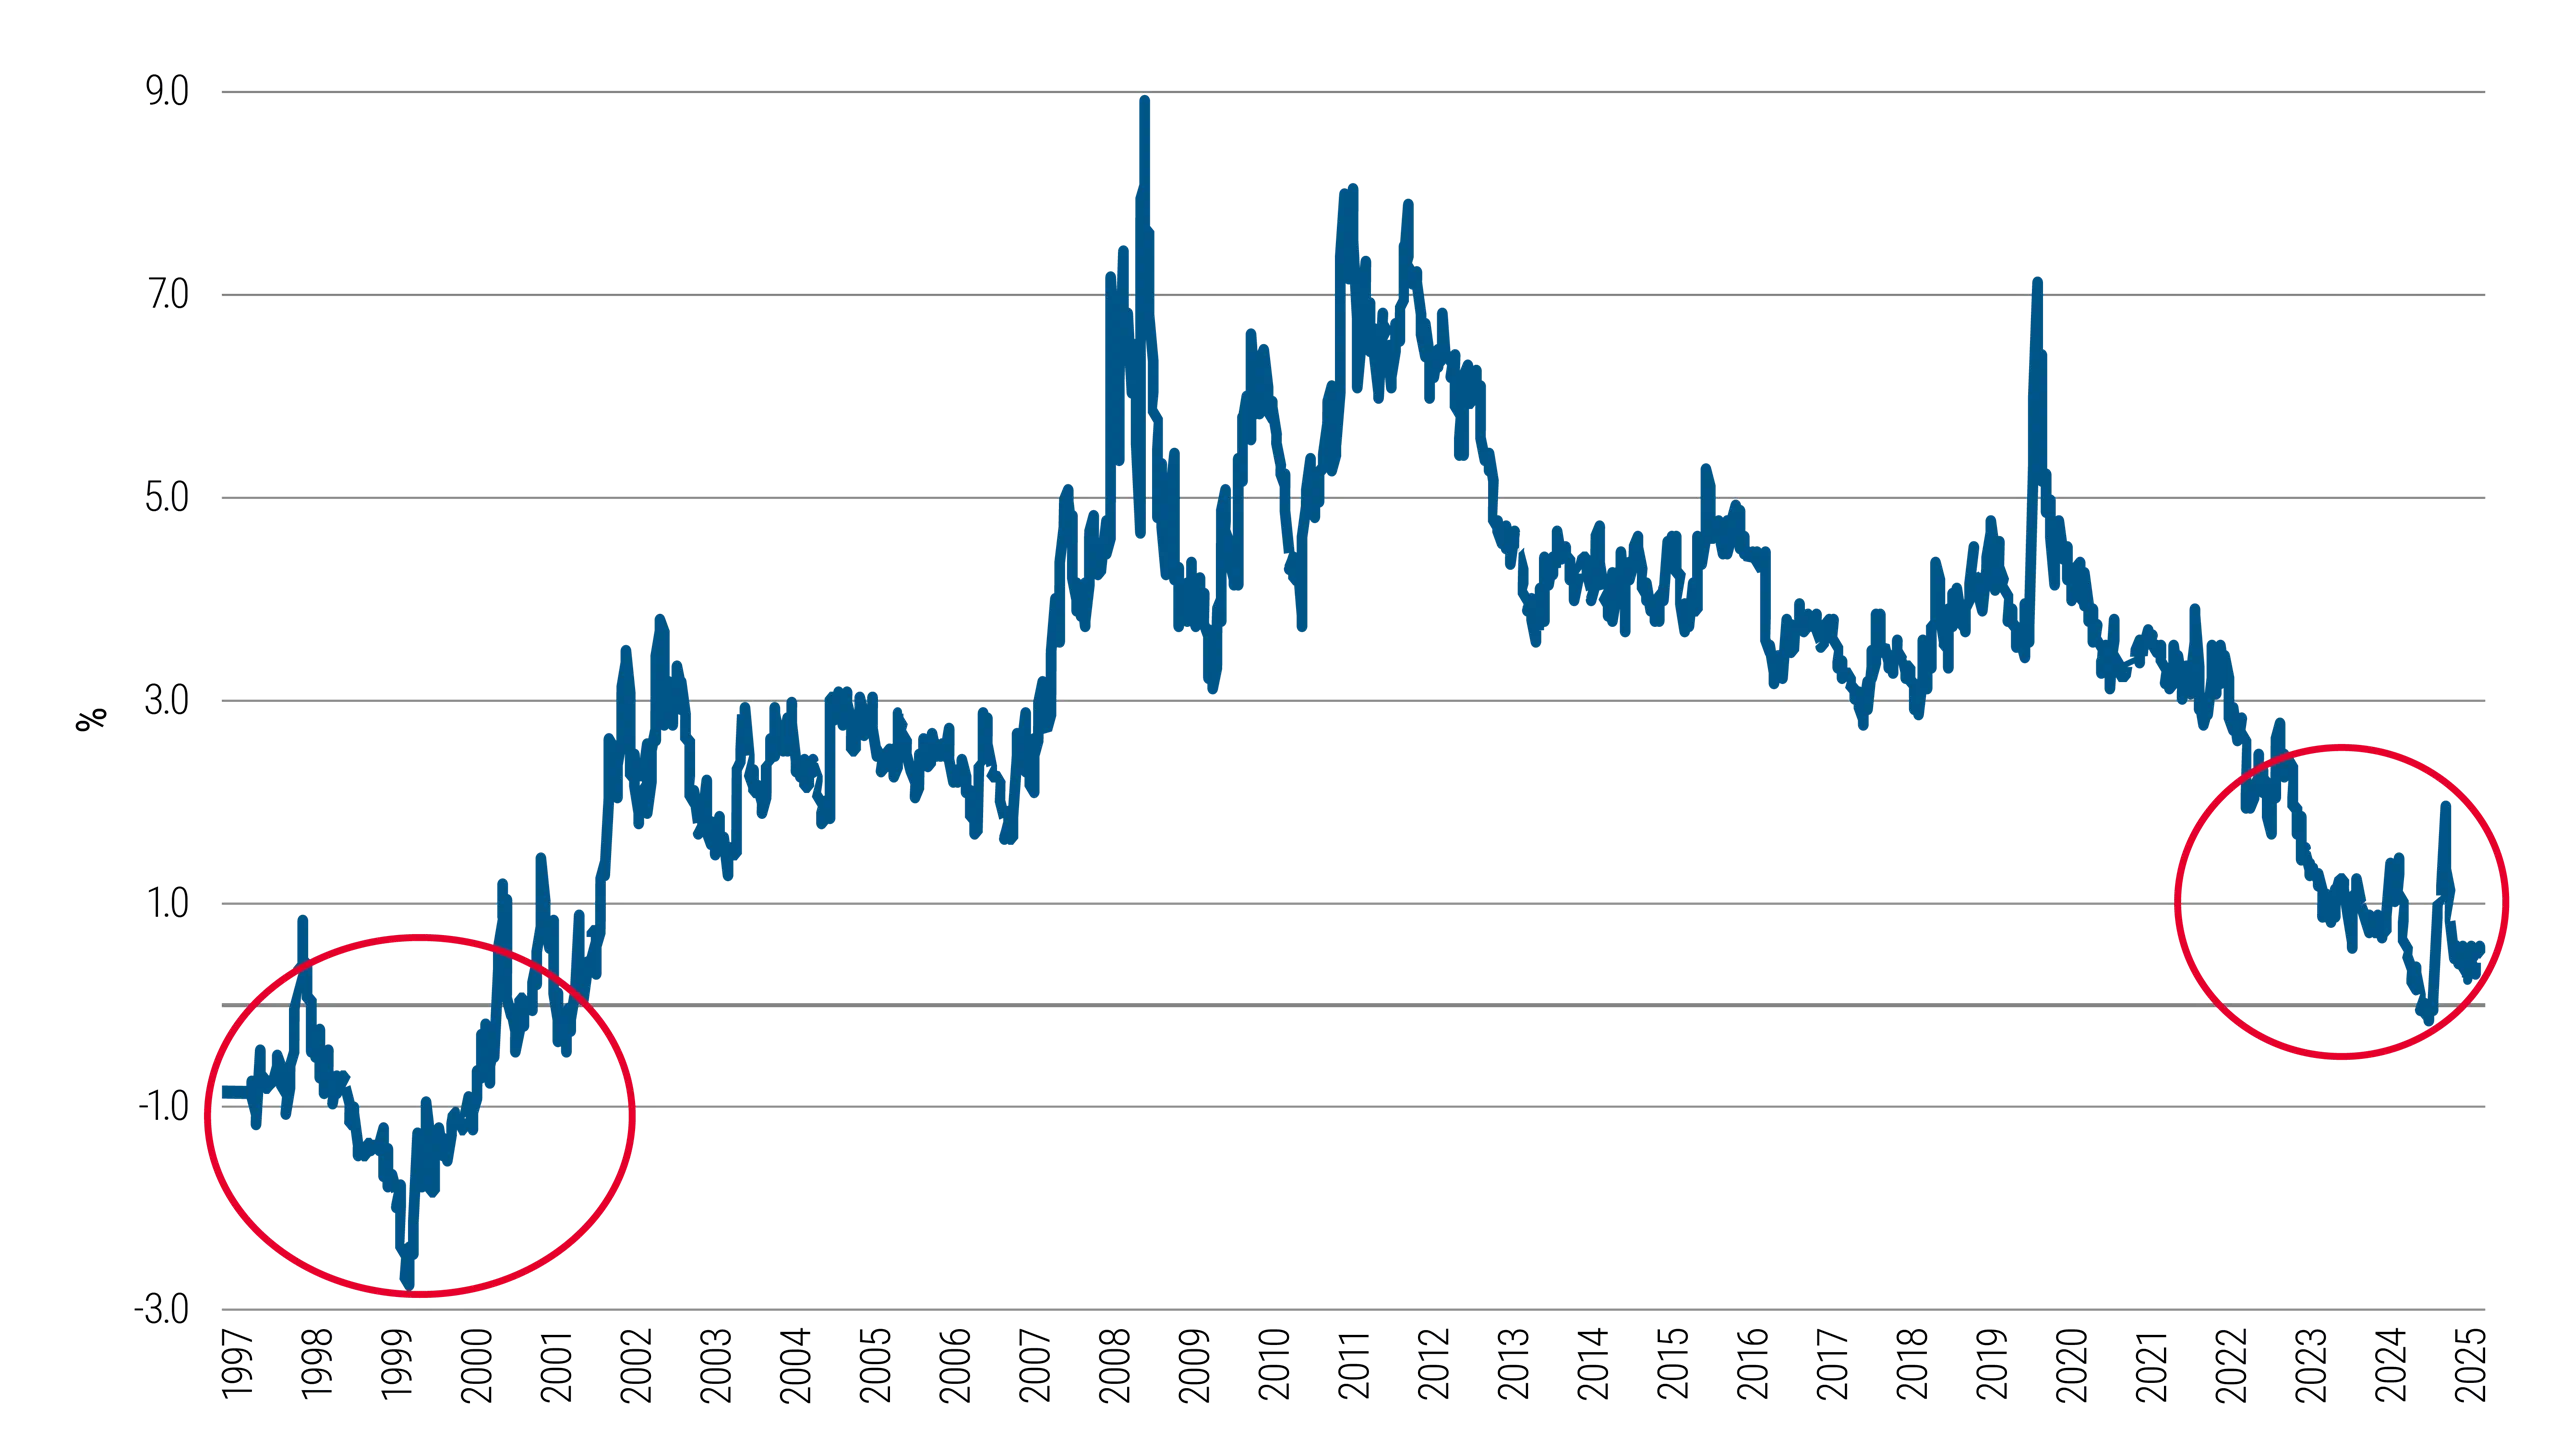
Source: Bloomberg data and PIMCO calculations as of August 2025. The S&P Hopes and Dreams Index, calculated by Cameron Crise from Bloomberg, tracks the remaining percentage of market value unexplained by the book value and the net present value of the next three years of earnings estimates for the companies. Past performance is not a guarantee or a reliable indicator of future results.
Market pricing reflects expectations for long-term uncertainty
But while stock markets appear optimistic and inflation expectations seem stable for now, the J.P. Morgan Hawk-Dove score suggests some wariness among bond investors. The difference between 10-year U.S. Treasury yields and the nominal neutral rate has risen above the levels signaled in Fed communications. This gap suggests the market is pricing in more risk for the long term.
This could put upward pressure on long-term interest rates. It also signals elevated uncertainty about future inflation and growth.
Fedspeak vs. the gap between 10-year U.S. Treasuries and the neutral rate
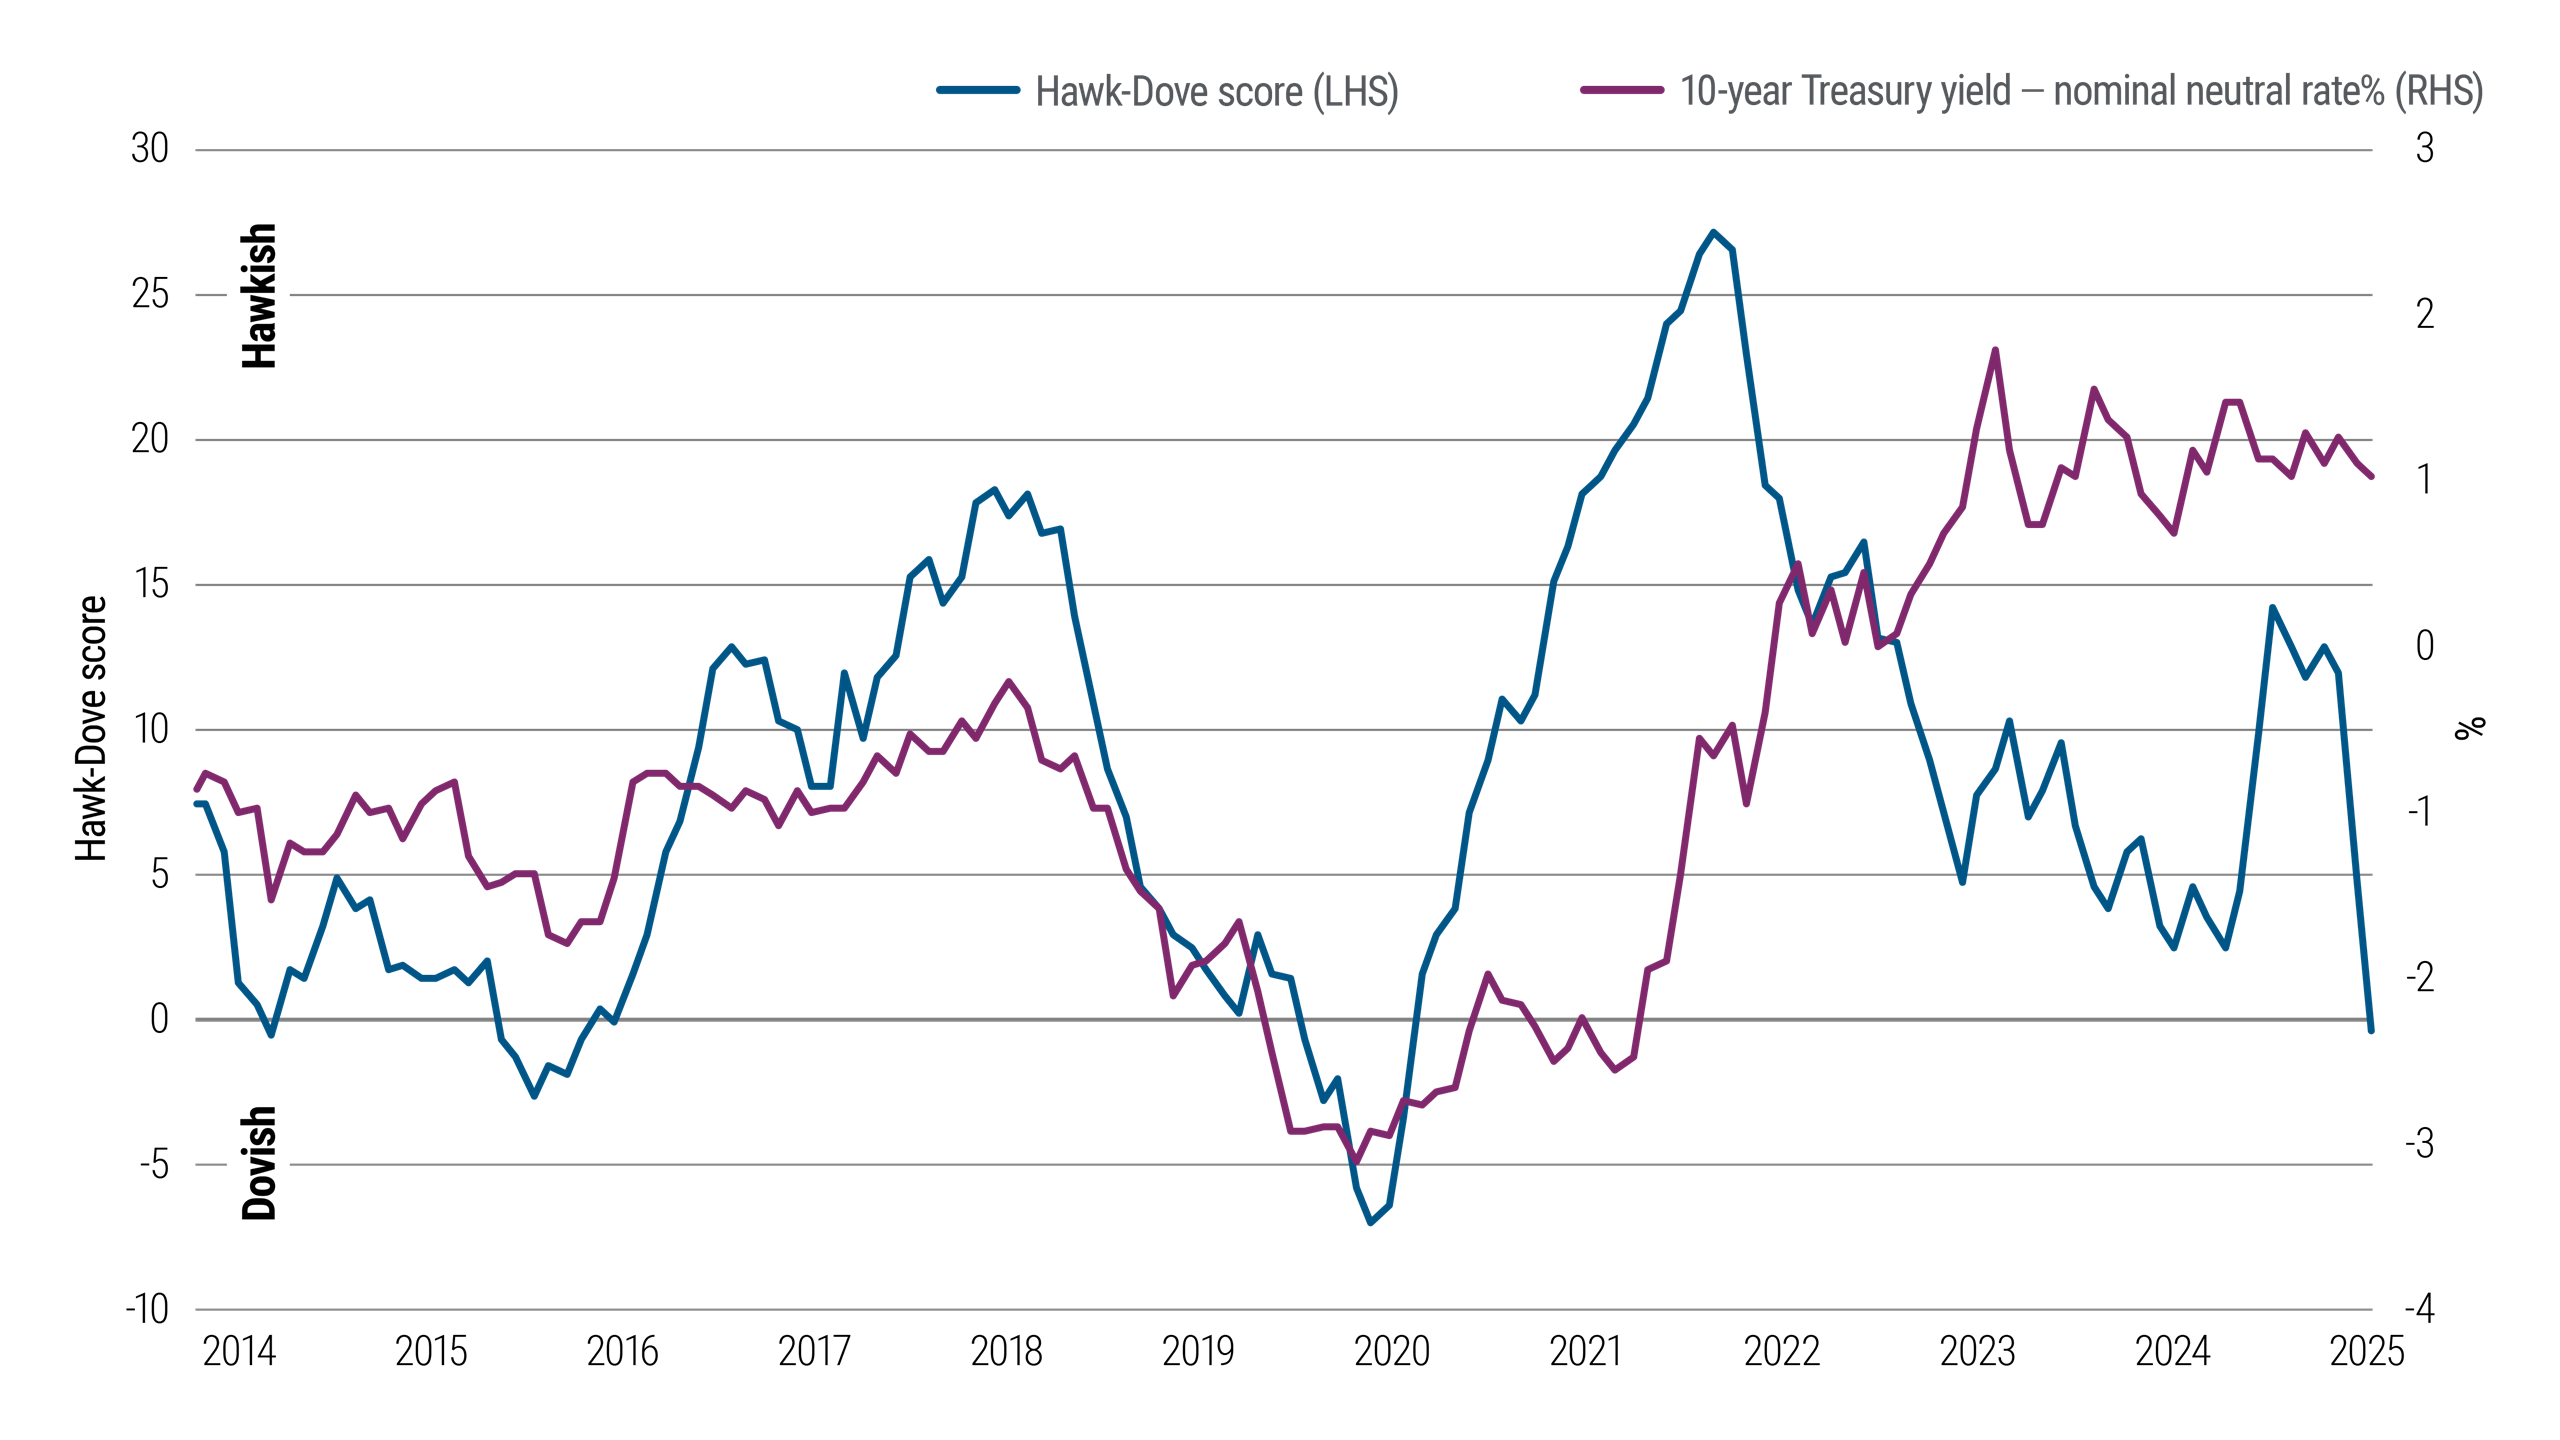
Source: Bloomberg, J.P. Morgan, and PIMCO calculations as of August 2025. The J.P. Morgan Hawk-Dove score assesses central bank communications to estimate monetary policy tendencies. The nominal neutral rate (often called r* or r-star) is an estimate of an interest rate that neither stimulates nor hinders economic growth. Past performance is not a guarantee or a reliable indicator of future results.
A long-term trend has reasserted itself: Benchmark US bond index yield exceeds the Fed policy rate
In late 2024, the Bloomberg US Aggregate Bond Index yield rose above the Fed’s policy rate for the first time in more than a year and has stayed there – emphasizing the compelling starting point for bonds now.
It was extraordinary to have a benchmark bond yield running below – sometimes well below – the policy rate. Prior to the pandemic, this had happened only four times in this century.
Fixed income offers an attractive opportunity with high starting yields. Historically, bonds have performed well across a range of different rate-cutting scenarios, and downward moves in bond yields have tended to follow cuts in the Fed policy rate.
Yield-to-worst on the Bloomberg US Aggregate Bond Index versus the fed funds rate
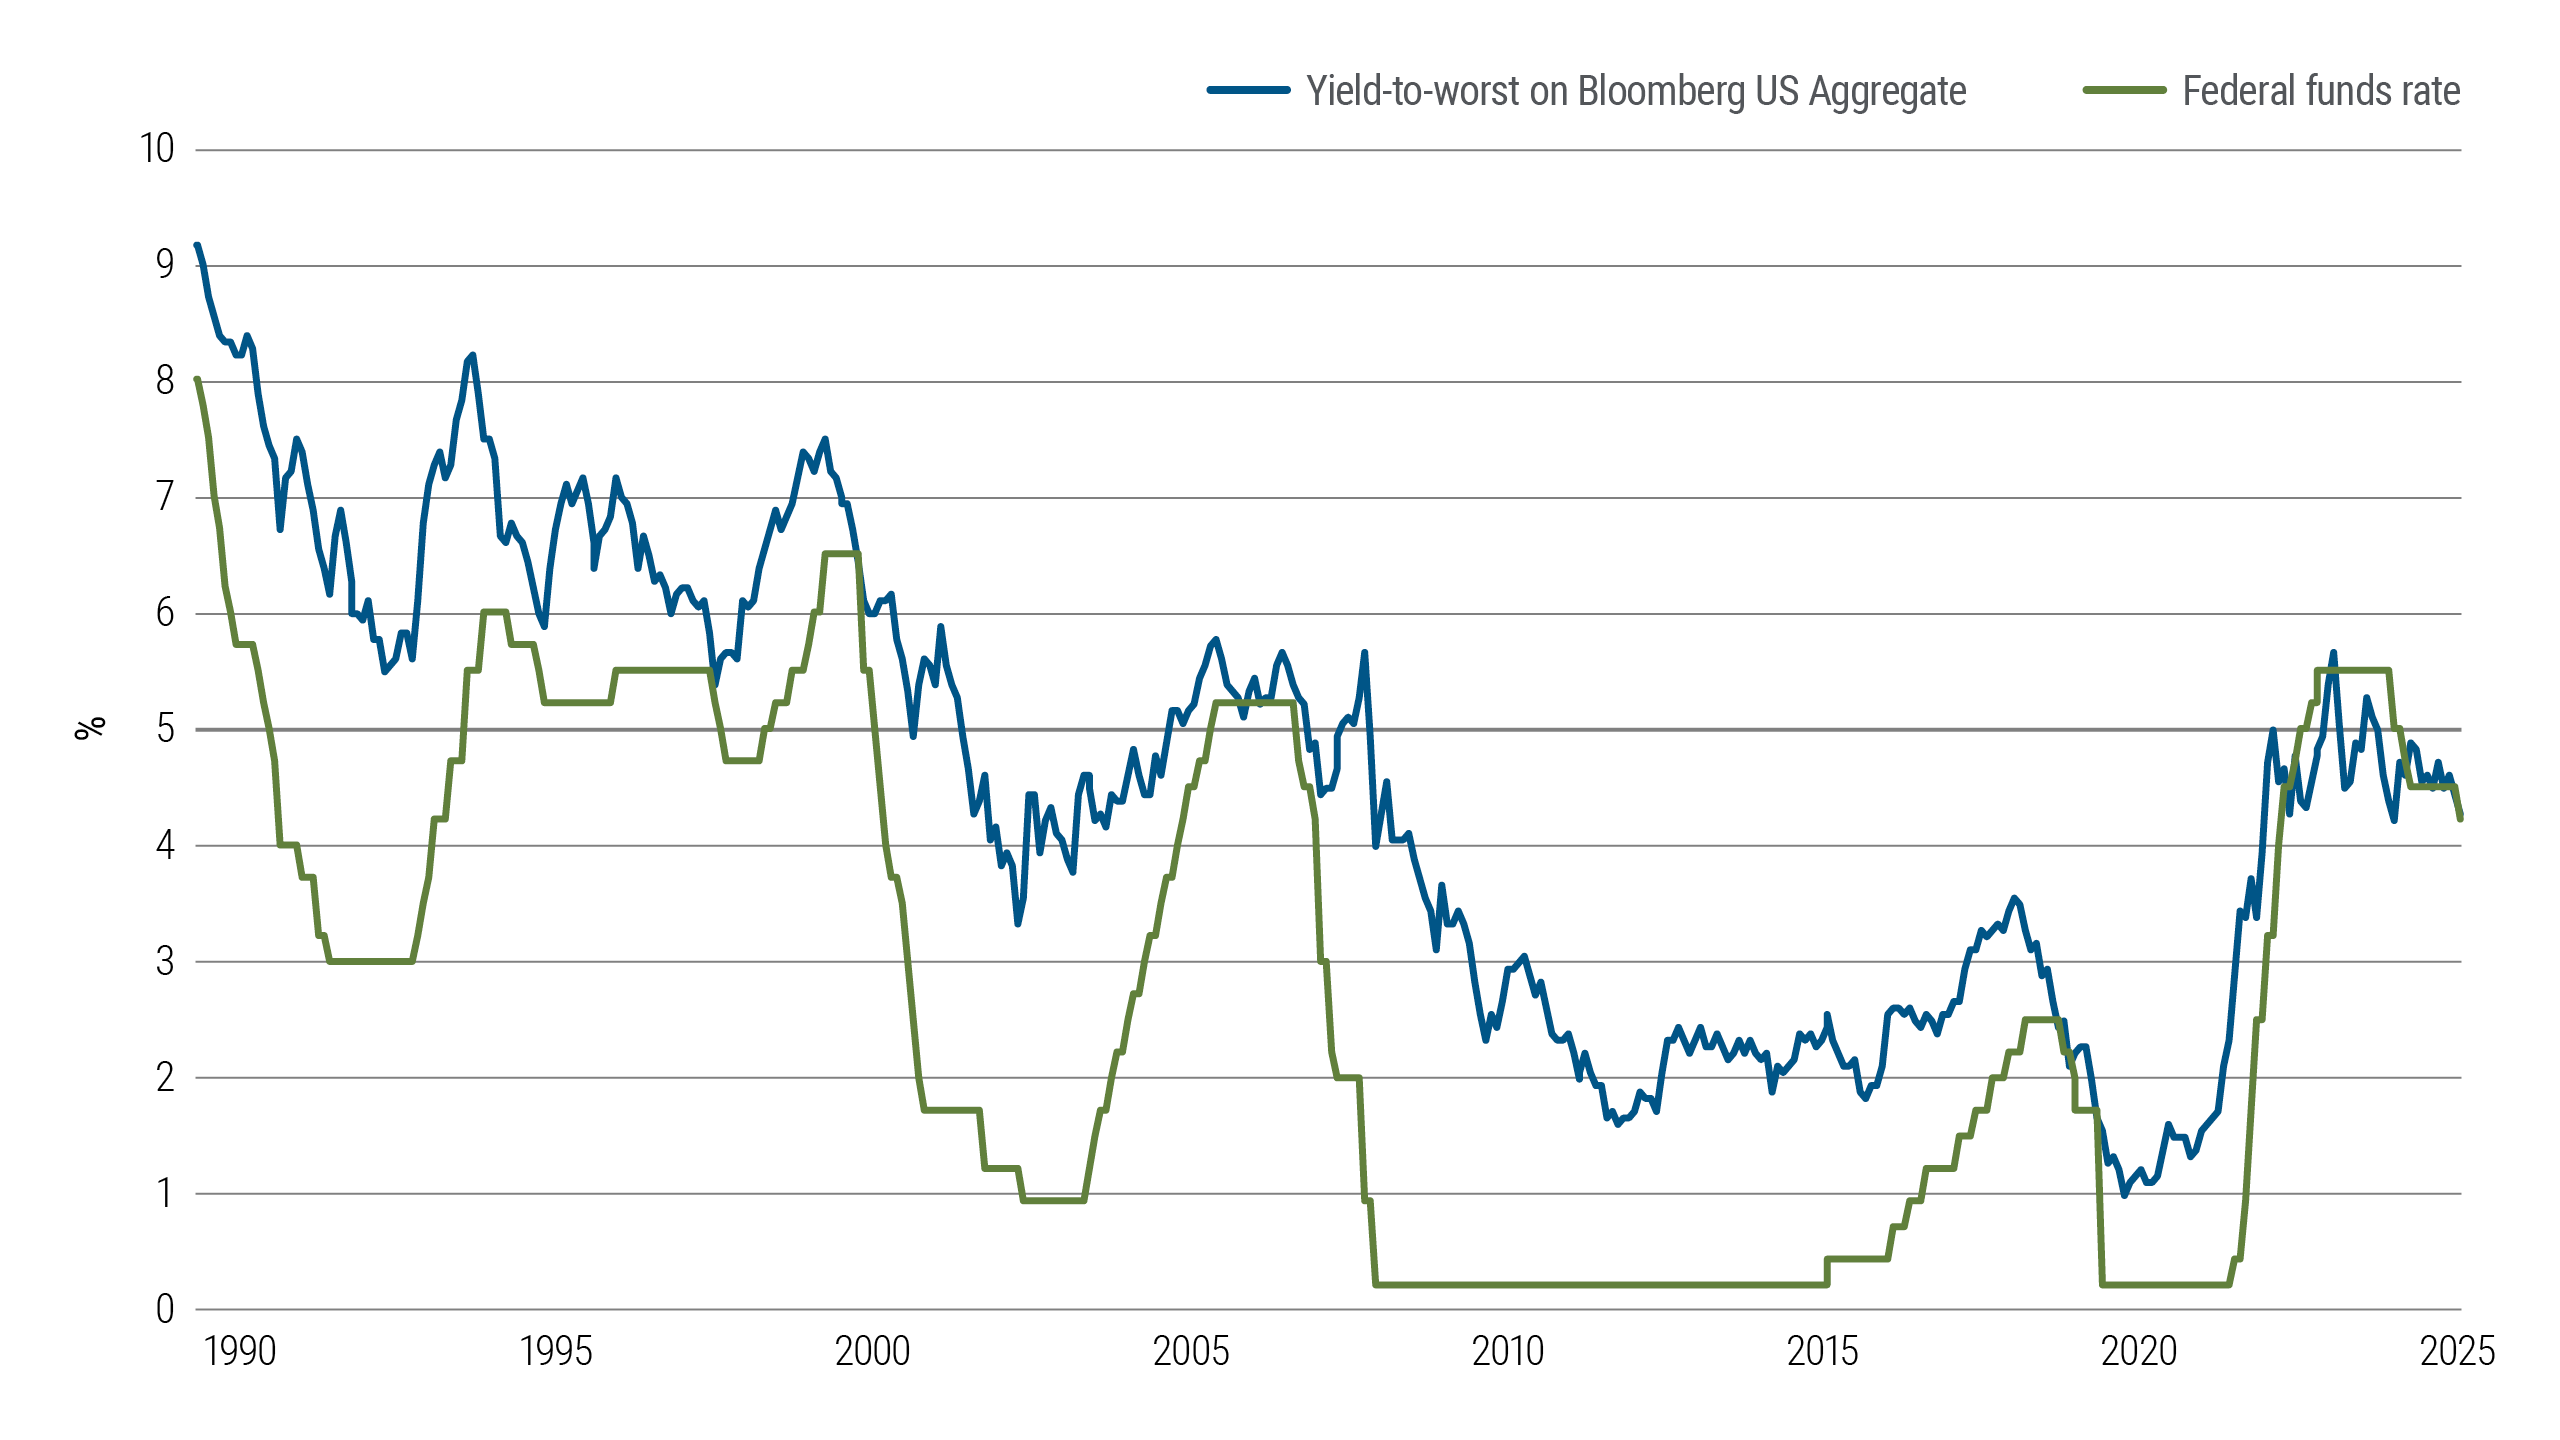
Source: U.S. Federal Reserve and Bloomberg as of September 2025. Yield-to-worst is the estimated lowest potential yield that can be received on a bond without the issuer actually defaulting. Past performance is not a guarantee or a reliable indicator of future results.
Market signals in German and U.S. inflation-linked bonds
Looking beyond the U.S., another long-term trend has returned during the post-pandemic recovery period: The yield on German 10-year inflation-indexed Bunds (or “linkers”) has remained in positive territory for nearly two years, after more than a decade below zero.
Linker yields still significantly lag the inflation-indexed yield on U.S. Treasury Inflation-Protected Securities (TIPS). TIPS yields have been hovering around 2% since 2023, but previously had been lower – even negative – in the low-inflation environment that followed the global financial crisis.
Higher inflation-indexed yields are another signal that fixed income may be an attractive, risk-aware investment in today’s uncertain macroeconomic environment.
Inflation-indexed yields on 10-year U.S. Treasuries and German Bunds
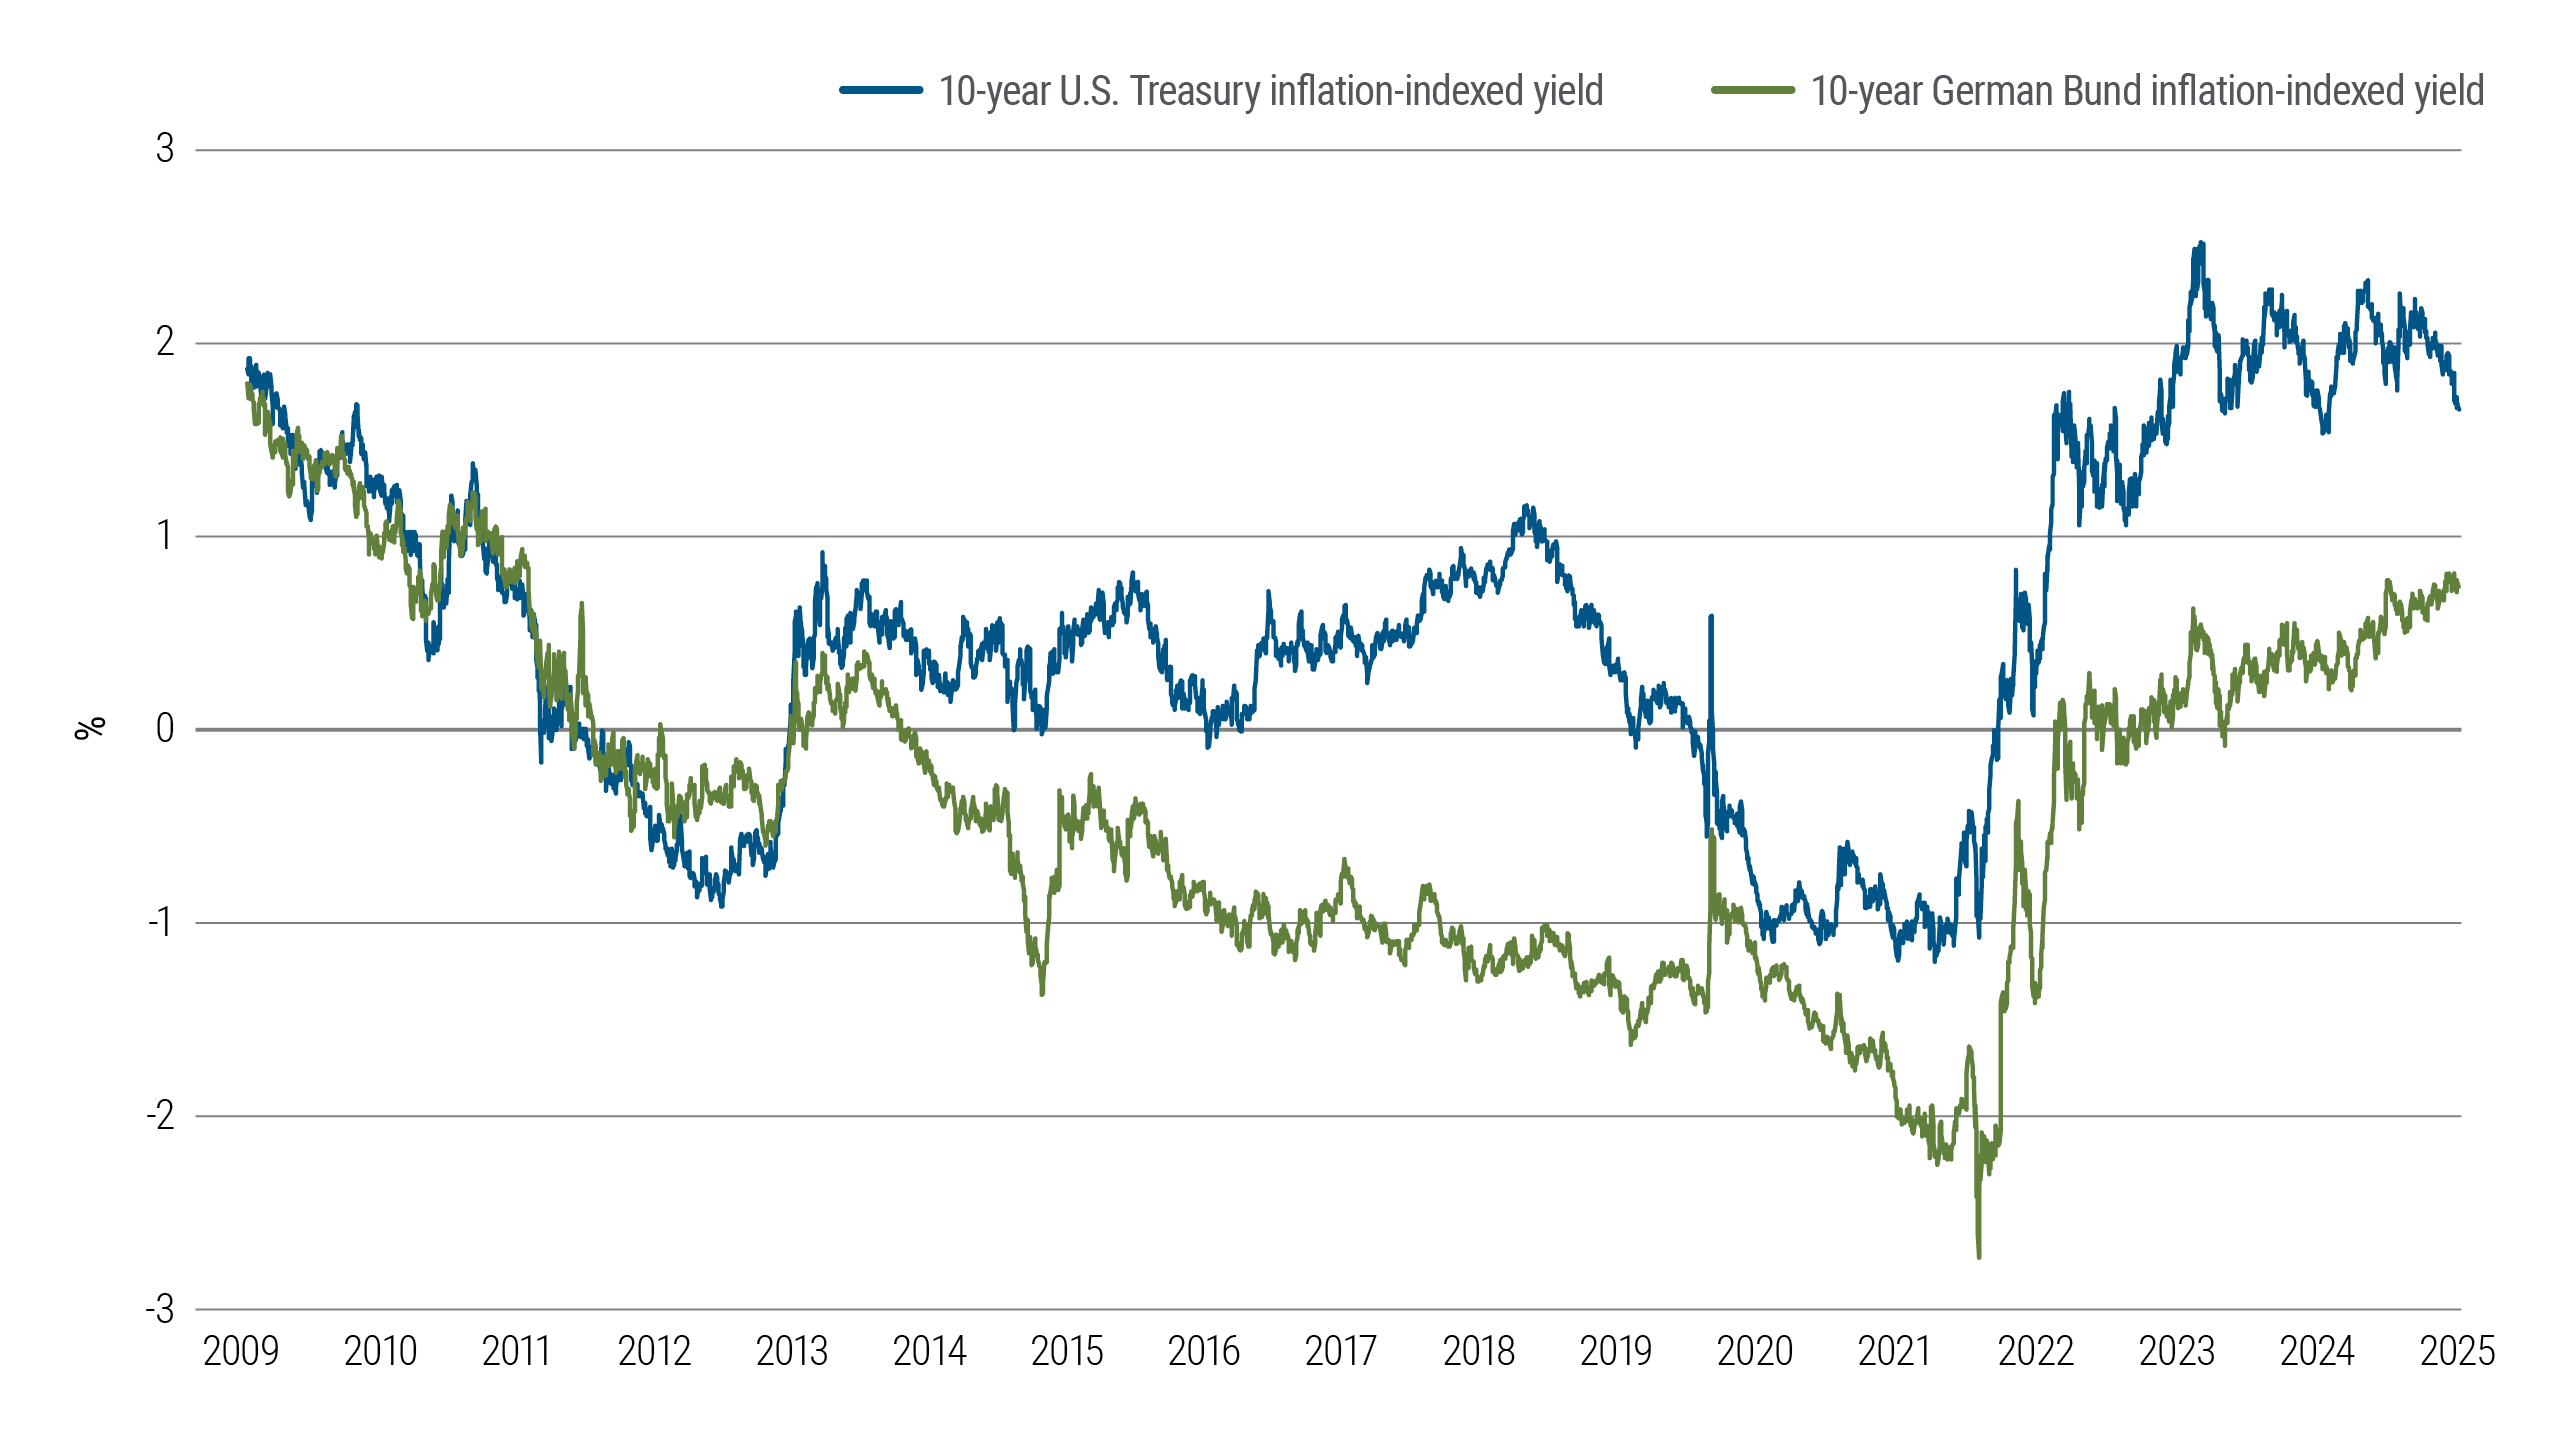
Source: Bloomberg data and PIMCO calculations as of August 2025. Past performance is not a guarantee or a reliable indicator of future results.
Disclosure: PIMCO
All investments contain risk and may lose value. This material is intended for informational purposes only. Forecasts, estimates and certain information contained herein are based upon proprietary research and should not be considered as investment advice or a recommendation of any particular security, strategy or investment product. No part of this material may be reproduced in any form, or referred to in any other publication, without express written permission. PIMCO is a trademark of Allianz Asset Management of America L.P. in the United States and throughout the world. THE NEW NEUTRAL is a trademark of Pacific Investment Management Company LLC in the United States and throughout the world. ©2023, PIMCO.
Disclosure: Interactive Brokers Third Party
Information posted on IBKR Campus that is provided by third-parties does NOT constitute a recommendation that you should contract for the services of that third party. Third-party participants who contribute to IBKR Campus are independent of Interactive Brokers and Interactive Brokers does not make any representations or warranties concerning the services offered, their past or future performance, or the accuracy of the information provided by the third party. Past performance is no guarantee of future results.
This material is from PIMCO and is being posted with its permission. The views expressed in this material are solely those of the author and/or PIMCO and Interactive Brokers is not endorsing or recommending any investment or trading discussed in the material. This material is not and should not be construed as an offer to buy or sell any security. It should not be construed as research or investment advice or a recommendation to buy, sell or hold any security or commodity. This material does not and is not intended to take into account the particular financial conditions, investment objectives or requirements of individual customers. Before acting on this material, you should consider whether it is suitable for your particular circumstances and, as necessary, seek professional advice.


Join The Conversation
If you have a general question, it may already be covered in our FAQs page. go to: IBKR Ireland FAQs or IBKR U.K. FAQs. If you have an account-specific question or concern, please reach out to Client Services: IBKR Ireland or IBKR U.K..
Visit IBKR U.K. Open an IBKR U.K. Account