


Investopedia is partnering with All Star Charts on this newsletter. The contents of this newsletter are for informational and educational purposes only.
Tech Just Hit a 25-Year High vs. the S&P 500
Microsoft is restarting Three Mile Island.
The same Pennsylvania nuclear plant that suffered America’s worst commercial nuclear accident in 1979 is being brought back online specifically to power Microsoft’s AI data centers.
The deal is signed, the federal loan is approved, and the reactor is targeted for grid sync in 2027. Microsoft is paying for 100% of the output for 20 years.
The largest cloud companies in the world need so much electricity to run AI that they are reopening shuttered nuclear plants to get it. Amazon already locked in 1,920 megawatts from the Susquehanna nuclear station next door.
Meta signed with Vistra in January, and Alphabet is funding a fleet of small modular reactors with Kairos Power.
The four hyperscalers, the largest cloud companies on the planet, are spending $800 billion combined in 2026 on AI infrastructure. That includes the data centers, the chips inside them, and now the power plants that run them.
Last week the market panicked about it. Microsoft dropped 4% in a single session after raising its capital expenditure (capex) guidance, and Meta dropped 8% on the same fear.
Investors looked at the bills and asked the obvious question. Are these companies paying for real revenue, or watching another 2000 inflate underneath them?
The chart had a different answer.
Past performance is not indicative of future returns.
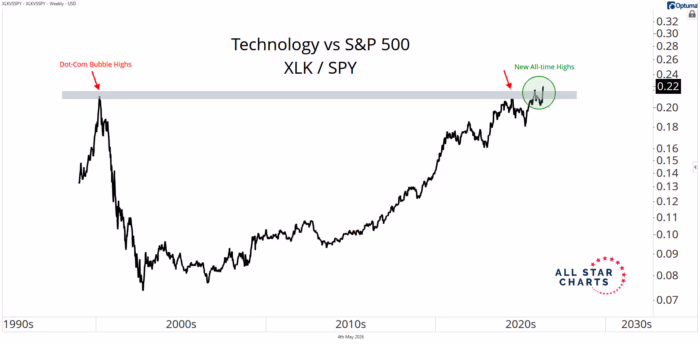
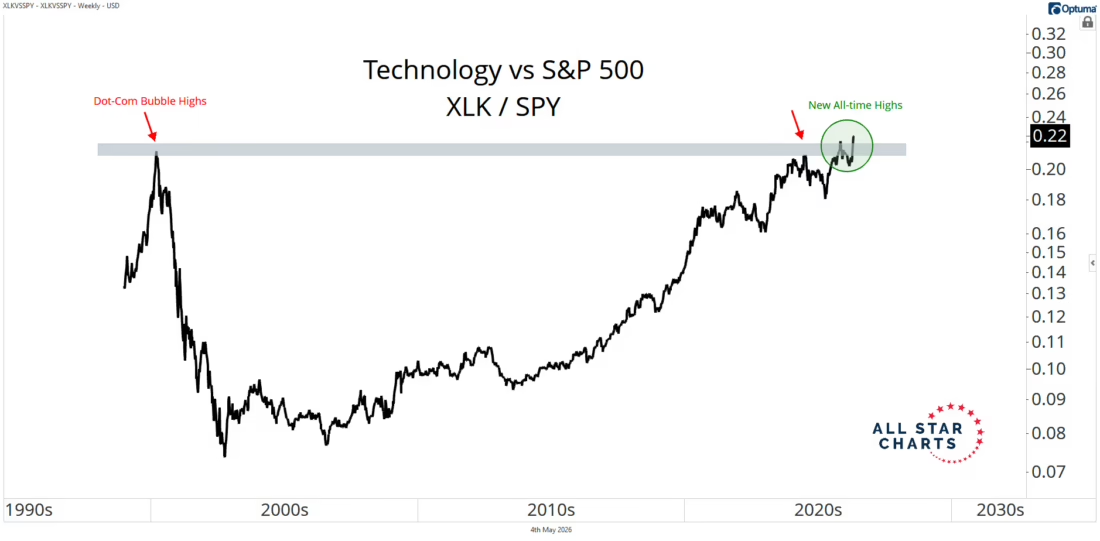
The Technology Select Sector ETF, ticker XLK, broke out to a new all-time high relative to the S&P 500.
Tech stocks as a group are now stronger relative to the rest of the market than at any point since the Dot-Com peak in March 2000.
That comparison chart is called a ratio chart. When you divide one ETF by another, you get a line that shows which group is winning. The XLK divided by SPY ratio has chopped against the same ceiling for 25 years.
Last week, it cut clean through. That kind of move is called a breakout.
Here is what most observers are missing.
XLK is not really a “technology” ETF. It is the AI buildout, packaged as a single ticker.
NVIDIA leads at 14.5% with the chips that train AI models. The cloud that runs on them is Microsoft’s, third in the basket at 9.3%.
Below them, Broadcom at 6% makes the optical chips that move data between GPUs, Micron at 4.5% supplies the memory those chips can’t function without, and AMD at 4.3% sells the alternative accelerator. Intel, Cisco, Palantir, and Lam Research round out the top 10, all levered directly to AI.
That is roughly 62% of the ETF in one decade-long story.
The chips, the memory, the equipment that builds the chips, the networking that connects them, the cloud that hosts the software, and the platform that turns it into business value.
This is what separates the current setup from 2000. Back then, the ratio peaked on companies trading at 200 times their annual earnings with no profits behind it.
Today, it is breaking out on companies posting 27% year-over-year earnings growth and an 84% beat rate in the most recent quarter.
The chart looks identical. The fundamentals do not.
What does this mean if your retirement account is heavy in technology?
The trend is intact, the breakout is supported by real revenue, and the AI capital cycle has not peaked.
The line to watch is the prior ceiling around 0.20 on the XLK/SPY ratio. As long as that level holds on a weekly close, the breakout is real.
The setup is one of the cleanest I see in the market right now.
The trend is up across every timeframe I check, the breakout is real, and the macro story has the largest companies in the world building physical infrastructure that requires reopening nuclear plants. This is not a bubble signal.
Real demand is showing up in real concrete, real chips, and real megawatts.
The risk is real. If AI revenue arrives slower than the capex bills, those infrastructure costs crush margins and the chart gives back the breakout. If XLK loses the 0.20 level on the ratio chart, the trend has changed and the long thesis is on hold.
For more ideas like this, read The Strazza Letter.
—
Originally posted 4th May 2026
Disclosure: Investopedia
Investopedia.com: The comments, opinions and analyses expressed herein are for informational purposes only and should not be considered individual investment advice or recommendations to invest in any security or to adopt any investment strategy. While we believe the information provided herein is reliable, we do not warrant its accuracy or completeness. The views and strategies described on our content may not be suitable for all investors. Because market and economic conditions are subject to rapid change, all comments, opinions and analyses contained within our content are rendered as of the date of the posting and may change without notice. The material is not intended as a complete analysis of every material fact regarding any country, region, market, industry, investment or strategy. This information is intended for US residents only.
Disclosure: Interactive Brokers Third Party
Information posted on IBKR Campus that is provided by third-parties does NOT constitute a recommendation that you should contract for the services of that third party. Third-party participants who contribute to IBKR Campus are independent of Interactive Brokers and Interactive Brokers does not make any representations or warranties concerning the services offered, their past or future performance, or the accuracy of the information provided by the third party. Past performance is no guarantee of future results.
This material is from Investopedia and is being posted with its permission. The views expressed in this material are solely those of the author and/or Investopedia and Interactive Brokers is not endorsing or recommending any investment or trading discussed in the material. This material is not and should not be construed as an offer to buy or sell any security. It should not be construed as research or investment advice or a recommendation to buy, sell or hold any security or commodity. This material does not and is not intended to take into account the particular financial conditions, investment objectives or requirements of individual customers. Before acting on this material, you should consider whether it is suitable for your particular circumstances and, as necessary, seek professional advice.
Disclosure: ETFs
Any discussion or mention of an ETF is not to be construed as recommendation, promotion or solicitation. All investors should review and consider associated investment risks, charges and expenses of the investment company or fund prior to investing. Before acting on this material, you should consider whether it is suitable for your particular circumstances and, as necessary, seek professional advice.


Join The Conversation
If you have a general question, it may already be covered in our FAQs page. go to: IBKR Ireland FAQs or IBKR U.K. FAQs. If you have an account-specific question or concern, please reach out to Client Services: IBKR Ireland or IBKR U.K..
Visit IBKR U.K. Open an IBKR U.K. Account