





Investopedia is partnering with All Star Charts on this newsletter. The contents of this newsletter are for informational and educational purposes only.
PBF just cleared a decade-long ceiling
Some stocks have ceilings for years.
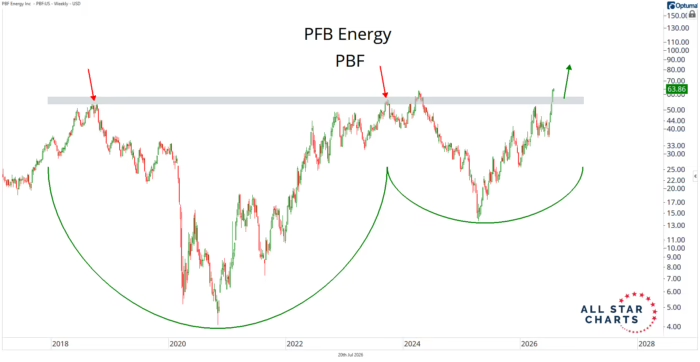
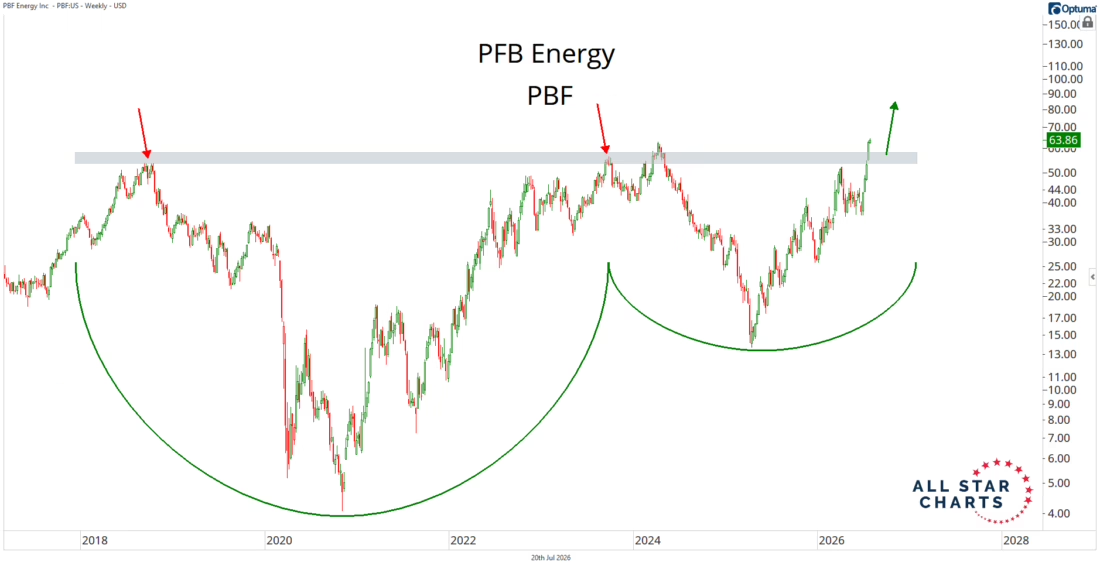
Every time they climb to a certain price, sellers show up and turn them away, and the stock slides back down to try again another day. PBF Energy has been fighting one of those ceilings at $55 for the better part of a decade.
Sellers turned it away there in 2018. They did it again in 2024. Two clean rejections at the same price, years apart, with a long, deep valley in between.
That valley is the story, because it isn’t the shape of a stock that’s dying. It’s the shape of one being quietly accumulated.
Chart readers call this a base on base. The stock carves out one long bottom, grinds partway back up, then builds a second bottom at a higher level before trying the ceiling again.
Each low sits above the last one. That rising floor is the tell. It means buyers are stepping in earlier and earlier, growing more willing to own the stock, while the crowd is still looking elsewhere.
Past performance is not indicative of future returns.
There’s a real reason behind the move, and it isn’t the price of oil. PBF is a refiner. What drives its profits is the crack spread, the gap between what it pays for a barrel of crude and what it sells the finished gasoline and diesel for.
That spread has widened dramatically this year, pushed higher as conflict around the Strait of Hormuz squeezed global fuel supply. A wider spread flows straight to a domestic refiner’s bottom line, and PBF’s chart is reflecting exactly that.
The skeptic has a fair point worth taking seriously. A stock that has already doubled, riding a crack spread inflated by a geopolitical event, is not a low-risk entry.
Spreads can compress as fast as they widened, and if the conflict cools, the tailwind that lit this move can fade just as quickly. That is a genuine risk, not a throwaway caveat.
But that same setup is what makes the level so useful. The risk here is easy to define.
A move back below $55 would negate the breakout and tell you the third rejection won the way the first two did. As long as the stock holds above that shelf, the base is doing what these patterns tend to do.
Refiners have been the leaders inside energy, and PBF is one of the cleaner setups in the group.
If this base plays out the way base-on-base patterns usually do, there’s room for the stock to run well beyond where it sits now. The line in the sand is simple, and it’s the same $55 that has defined this chart for years.
Earnings Season Just Opened. Big Tech Reports Next.
And this little-known earnings trade has won 1,500+ times in a row.
The banks already reported. Amazon, Alphabet, Microsoft, Meta, and Apple are next — right in the middle of an unresolved tech consolidation. See the exact trade live before it plays out.
Register for Free→ Free · Online · Replay for registrants
Date: Wednesday, July 22, 2026
Time: 11:00 AM EST
Where: Online — link sent upon registration
—
Originally posted 21st July 2026
Disclosure: Investopedia
Investopedia.com: The comments, opinions and analyses expressed herein are for informational purposes only and should not be considered individual investment advice or recommendations to invest in any security or to adopt any investment strategy. While we believe the information provided herein is reliable, we do not warrant its accuracy or completeness. The views and strategies described on our content may not be suitable for all investors. Because market and economic conditions are subject to rapid change, all comments, opinions and analyses contained within our content are rendered as of the date of the posting and may change without notice. The material is not intended as a complete analysis of every material fact regarding any country, region, market, industry, investment or strategy. This information is intended for US residents only.
Disclosure: Interactive Brokers Third Party
Information posted on IBKR Campus that is provided by third-parties does NOT constitute a recommendation that you should contract for the services of that third party. Third-party participants who contribute to IBKR Campus are independent of Interactive Brokers and Interactive Brokers does not make any representations or warranties concerning the services offered, their past or future performance, or the accuracy of the information provided by the third party. Past performance is no guarantee of future results.
This material is from Investopedia and is being posted with its permission. The views expressed in this material are solely those of the author and/or Investopedia and Interactive Brokers is not endorsing or recommending any investment or trading discussed in the material. This material is not and should not be construed as an offer to buy or sell any security. It should not be construed as research or investment advice or a recommendation to buy, sell or hold any security or commodity. This material does not and is not intended to take into account the particular financial conditions, investment objectives or requirements of individual customers. Before acting on this material, you should consider whether it is suitable for your particular circumstances and, as necessary, seek professional advice.





Join The Conversation
If you have a general question, it may already be covered in our FAQs page. go to: IBKR Ireland FAQs or IBKR U.K. FAQs. If you have an account-specific question or concern, please reach out to Client Services: IBKR Ireland or IBKR U.K..
Visit IBKR U.K. Open an IBKR U.K. Account