












Modest oil price relief is lifting markets prior to this afternoon’s Federal Reserve decision, which is largely expected to be the first interest rate hike in over three years. Today’s slight drop in fuel charges, WTI is still at $103, comes as Middle East supply disruptions near Riyadh appear to be easing, a development that is soothing fears regarding a potential shortage of crude barrels in the region. The news has yields falling across the curve, with the bull-steepener slide especially pronounced at the monetary policy sensitive shorter end. A 12-month low on homebuilder sentiment additionally helped fixed-income assets climb. The loosening financial conditions alongside a big beat on retail sales, which posted the strongest gain in five months, are bolstering equities as cheaper credit and a robust consumer are positives for corporate earnings prospects. Stocks are advancing broadly, with every major equity benchmark, sector and subcategory climbing except energy and financials amidst premiums on volatility protection instruments decreasing in light of the risk-on attitudes. Elsewhere, non-energy commodities and the greenback are appreciating.
Consumer Spending Bounced Back in August
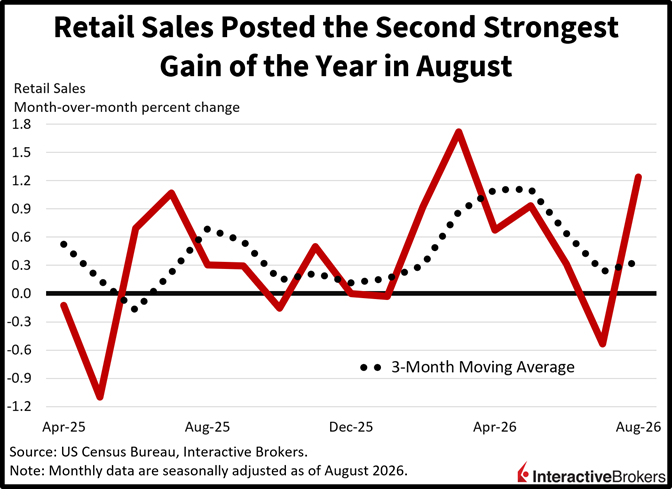
Retail sales recovered last month and posted the second-strongest gain of 2026. Transactions expanded 1.2% month over month (m/m), beating the 0.8% median forecast and the 0.5% July contraction. Growth was broad with 12 of the 13 major categories posting increases. Groups with the strongest gains and the extent of their m/m growth included the following:
- Gasoline stations, 3.1%
- Ecommerce, 2.6%
- Miscellaneous stores, 1.9%
- Electronics/appliance destinations, 1.6%,
- Sporting goods shops, 1.2%
- Restaurants/bars, 1.2%
The other positive segments all rose at rates between 0.4% and 0.9% m/m, while building materials and garden equipment establishments saw a 0.2% m/m decrease. The control group, a critical number within the publication that is inputted into the government’s gross domestic product calculation, soared 1.4% m/m, the most in over a year, and arrived ahead of the projected 0.4% advance and the prior period’s 0.4% decline.
Past performance is not indicative of future results.
But Fall in Homebuilder Sentiment Continues
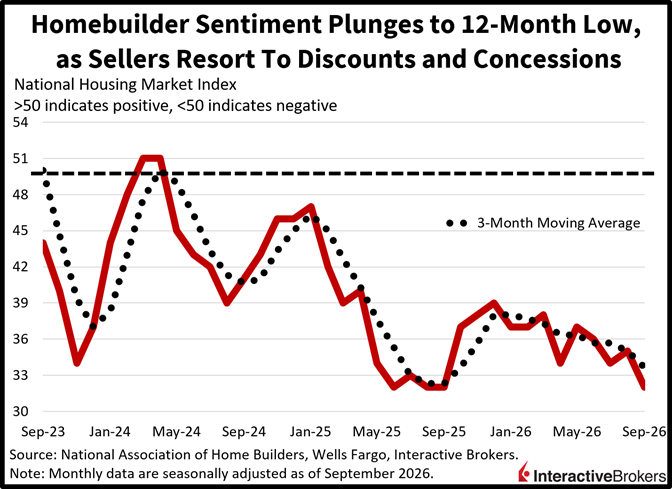
Homebuilder sentiment hit its weakest level in 12 months in September, as sellers had to resort to discounts and concessions to drive sales in a 7-handle mortgage environment. The headline figure of 32 was well below the expected 34 and August’s 35 amidst declines across categories and regions against the backdrop of challenging affordability conditions caused by lofty valuations, elevated financing charges, high material costs and subdued labor supply. The subindices covering closings in the present and the six-month outlook, fell from 39 and 43 to 35 and 37, while the traffic of prospective buyers component was unchanged at a depressed 23. Similarly, the Northeast, Midwest and South fell from 42, 45 and 33 to 35, 41 and 29, while the West bucked the trend, rising from 28 to 29.
Past performance is not indicative of future results.
Duration Due for an Extended Bounce
The painful conditions for duration could improve meaningfully this afternoon as the Fed regains its inflation-fighting and dollar-defending credibility by raising rates for the first time since 2023. A 25-basis point hike paired with commentary consistent with a central bank that’s committed to quelling price pressures would lower cost pressure expectations while lifting slowdown risk, which should get factored onto the curve and trigger long-end outperformance. Meanwhile, today’s notable plunge in yields even as West Texas Intermediate crude stands at $103 per barrel is emblematic of the current outsized upside potential for bonds because there’s an abundance of room for geopolitical improvements. A development featuring cheaper fuel charges and a looser credit environment would remove two of the greatest headwinds for stocks as we navigate a seasonally weak September and enter the heat of the Midterm election season.
International Roundup
Euro Area Industrial Production Weakens
Industrial production in the euro area slipped 0.1% m/m in July, which matched the preceding month’s result, according to Eurostat. The print was only slightly better than the economist consensus estimate for a 0.2% fall. When compared to the year-ago period, production was flat within the euro area, which is a group of countries that use the euro currency.
Non-durable consumer goods were a headwind with production sinking 1.6% m/m. Other broad categories expanded output as follows:
- Intermediate goods, 0.3%
- Energy, 0.9%
- Capital goods, 0.5%
- Durable consumer goods, 0.9%
Among countries, Denmark, Bulgaria and Lithuania experienced the largest contractions with declines of 4.2%, 2.9% and 2.4% while Luxembourg, Croatia and Ireland posted the best results with output increasing by 4.5%, 3.9% and 2.6%.
While Labor Costs Climb Slightly Faster than Expected
Labor costs in the euro area climbed 3.10% during the second quarter, a marginally faster pace than the economist consensus estimate of 3% but slower than the first quarter’s 3.2% gain, according to Eurostat. Non-wage costs, furthermore, were up 3.2%. Hourly labor costs were also up 3.1% y/y among non-business employers and 3% among businesses. Construction labor costs jumped the fastest with a y/y climb of 3.9%. Labor costs in the services sector and industry category ascended 3% and 2.9%, respectively, y/y.
And Trade Surplus Grows
The euro area’s July trade surplus is estimated to have grown from €10.7 billion to €14.2 billion on a y/y basis, according to estimates from Eurostat. Exports are expected to have risen by 9% while imports were likely up only 7.9%. The surplus nearly doubled from June, when the value of shipments abroad exceeded the value of imports by €7.2 billion. The provisional data points to July by the fourth straight monthly surplus following deficits during the first three months of 2026. In July, the chemicals and related products category and the machineries and vehicles classification were the strongest groups with surpluses of €20.6 billion and €13.5 billion, which helped offset energy and raw materials trade deficits of €24.3 billion and €2.3 billion.
Among its largest trading partners, the European Union, which consists of countries that fall under the monetary policies of the European Central Bank, generated a €17.9 billion surplus with the US, representing a €5.3 billion y/y rise despite ongoing uncertainty regarding tariffs. Conversely, the EU’s deficit with China steepened from €32.3 billion to €36.5 billion y/y.
UK Price Pressures Strengthen
Inflation in the UK strengthened last month with the Consumer Price Index climbing 3.1% and 0.5%% y/y and m/m, according to the Office for National Statistics. In July, the gauges depicted costs climbed 2.9% and 0.3% y/y and m/m. The transport component, and in particular, motor fuel, made the largest upward contributions to the annual metric. More broadly, the goods component of the CPI contributed to the loftier prices with its y/y rate accelerating from 2.2% to 2.7% while the services gauge was unchanged at 3.4%. While headline inflation intensified, core price pressures, or costs that exclude energy, food, alcohol and tobacco, were more benign. The 2.6% y/y climb was a repeat of July’s print.
New to Interactive Brokers?
Open AccountDisclosure: Interactive Brokers Affiliate
Information posted on IBKR Campus that is provided by third-parties does NOT constitute a recommendation that you should contract for the services of that third party. Third-party participants who contribute to IBKR Campus are independent of Interactive Brokers and Interactive Brokers does not make any representations or warranties concerning the services offered, their past or future performance, or the accuracy of the information provided by the third party. Past performance is no guarantee of future results.
This material is from IBKR Macroeconomics, an affiliate of Interactive Brokers LLC, and is being posted with its permission. The views expressed in this material are solely those of the author and/or IBKR Macroeconomics and Interactive Brokers is not endorsing or recommending any investment or trading discussed in the material. This material is not and should not be construed as an offer to buy or sell any security. It should not be construed as research or investment advice or a recommendation to buy, sell or hold any security or commodity. This material does not and is not intended to take into account the particular financial conditions, investment objectives or requirements of individual customers. Before acting on this material, you should consider whether it is suitable for your particular circumstances and, as necessary, seek professional advice.





Join The Conversation
If you have a general question, it may already be covered in our FAQs page. go to: IBKR Ireland FAQs or IBKR U.K. FAQs. If you have an account-specific question or concern, please reach out to Client Services: IBKR Ireland or IBKR U.K..
Visit IBKR U.K. Open an IBKR U.K. Account