


From SIA Charts
1/ AT&T Inc. (T)
2/ Candlestick Chart
3/ Point and Figure Chart
Investopedia is partnering with CMT Association on this newsletter. The contents of this newsletter are for informational and educational purposes only, however, and do not constitute investing advice. The guest authors, which may sell research to investors, and may trade or hold positions in securities mentioned herein do not represent the views of CMT Association or Investopedia. Please consult a financial advisor for investment recommendations and services.
1/
AT&T Inc. (T)
Past performance is not indicative of future results
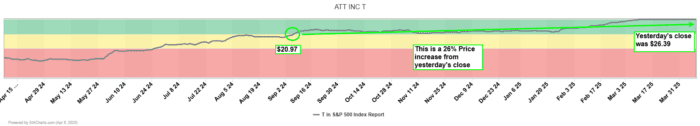
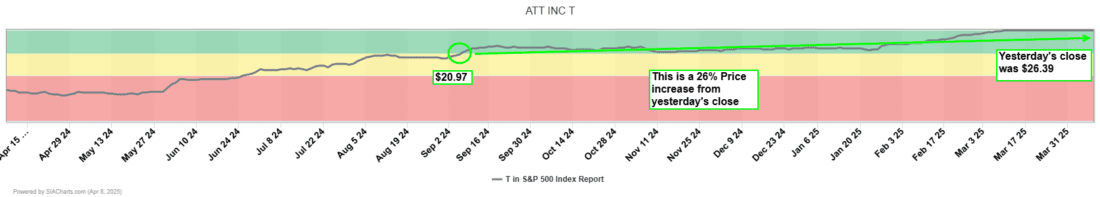
In today’s edition of the Daily Stock Report, we are going to feature AT&T Inc (T). This is the first time we have looked at AT&T Inc in our daily commentary. With the growing market uncertainty over the last quarter, money flows are migrating towards defensive sectors such as a tried and true Telecommunications name such as AT&T due to its appealing dividend yield, providing a reliable income stream and a buffer against share price declines when market conditions are uncertain. The SIA Platform picked up on this positive money inflows well before the markets started to become challenging, highlighting the power of the SIA Platform and how you can get valuable calls to action on where to look for opportunities.
AT&T has shown consistent strength over the last little while moving up 2 spots in the last week, 6 spots in the last month and 101 spots in the last quarter in SIA’s S&P 500 Index Report. It currently sits at the top of the Favored Zone in the SIA S&P 500 Index in the #1 spot in the report. AT&T first entered the Favored zone on September 6, 2024, at a price of $20.97. At yesterday’s close, the shares are at $26.39 representing a 25.8% increase in a little over 7 months and this does not even include its compelling annual dividend yield of 4.14%.
2/
Candlestick Chart
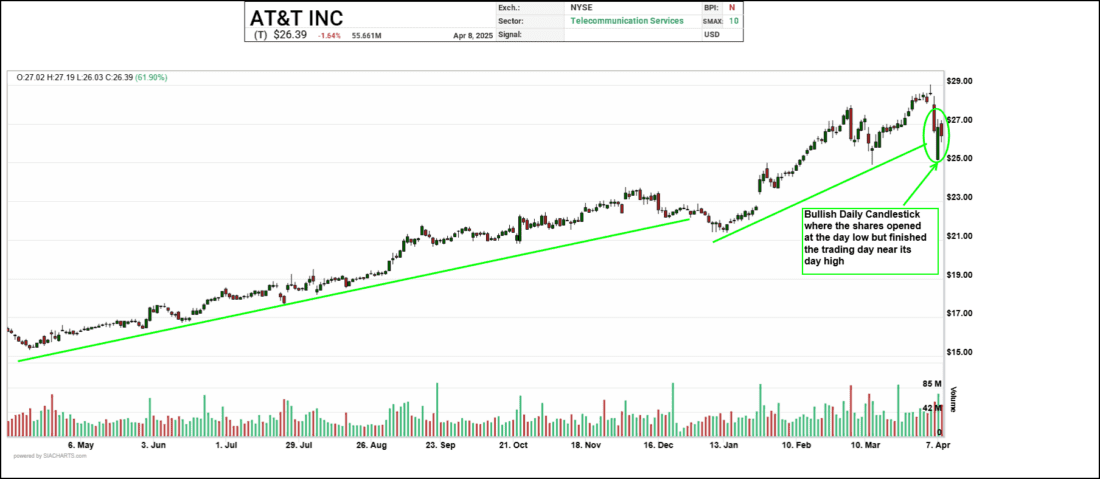
In looking at the Daily Candlestick Chart, we see the stock has been in a steady uptrend in the past year with a pattern of higher highs and higher lows. On April 7, a bullish candlestick developed where the shares opened at the day low but finished the trading day near its day high. This is indicative of the buyers stepping in as market participants are viewing this as fair value or an opportunity. When the trade wars and subsequent market volatility really started to escalate here in the past month the shares still held up admirably with a one month return of -2.69% compared to the one month trailing performance return of the S&P 500 of negative -13.65%, representing a 10.96% outperformance in these challenging markets.
In looking at a trailing 3 month timespan, the differences are even more impressive with AT&T up +20.49% while the S&P 500 down -15.81% representing a whopping 36.30% outperformance in this short 3 month time period. Support can be found at the $25 area where the buyers stepped on April 7th. Potential resistance can be found at the recent high of approximately $28.50.
Past performance is not indicative of future results
3/
Point and Figure Chart
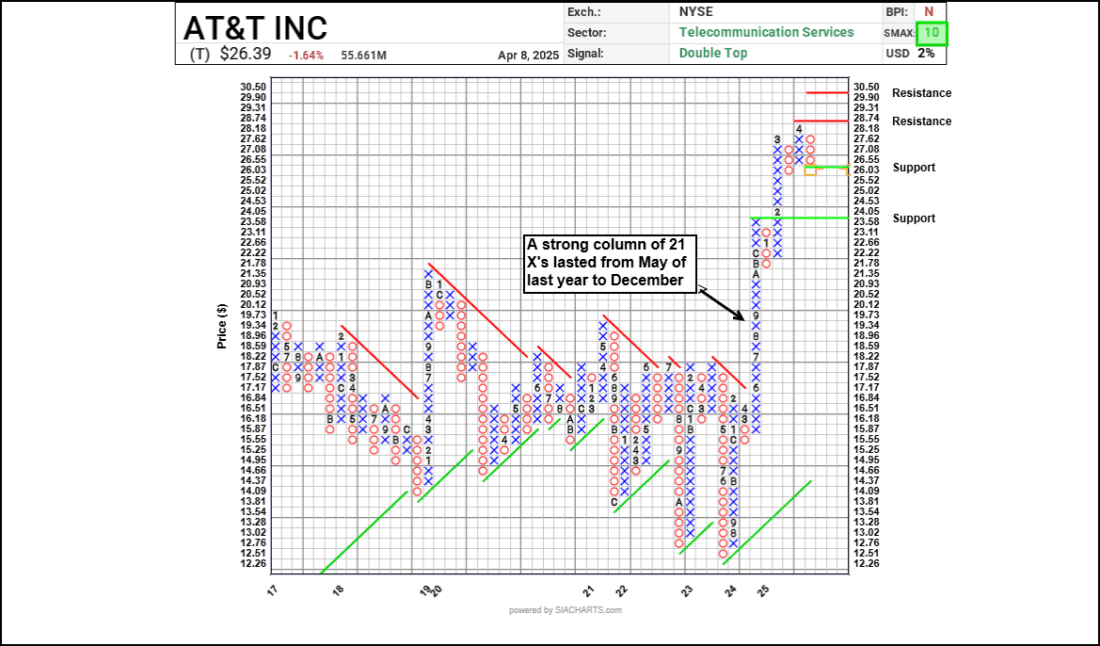
In looking at a 2% scale on a Point the Figure Chart, we see the shares have been in a very strong and steady uptrend of a column of 21 X’s since May of 2024 up until December. Since that time 3 short pullbacks ensured, lasting 4 boxes in January and another lasting only 3 boxes last month and another 3 box reversal today. Most recently we see the shares had established a new high, breaking above March’s peak at $27.62 before succumbing to a 3 box reversal. It will be interesting to see if the shares continue its upward movement after 2 previous mild pullbacks it experienced earlier this year. The shares are right at support at the 3 box reversal of $26.03 and, below that, $23.58. If a new uptrend materializes, next resistance is at $28.74 and above that, $30.50 based on a measured move. With a SMAX score of a perfect 10 out of 10, AT&T is showing near term strength against all the asset classes. AT&T is the third- largest U.S. wireless carrier, connecting 67 million postpaid and 17 million prepaid phone customers. Fixed-line enterprise services, which account for about 20% of revenue, include internet access, private networking, security, voice, and wholesale network capacity. Residential fixed-line services, about 10% of revenue, primarily consist of broadband internet access service. AT&T also has a sizable presence in Mexico, serving 20 million customers, but this business only accounts for 2% of revenue. The firm still holds a 70% equity stake in satellite television provider DirecTV but does not consolidate this business in its financial statements.
Past performance is not indicative of future results
Past performance is not indicative of future results
—
Originally posted 10th April 2025
Disclosure: Investopedia
Investopedia.com: The comments, opinions and analyses expressed herein are for informational purposes only and should not be considered individual investment advice or recommendations to invest in any security or to adopt any investment strategy. While we believe the information provided herein is reliable, we do not warrant its accuracy or completeness. The views and strategies described on our content may not be suitable for all investors. Because market and economic conditions are subject to rapid change, all comments, opinions and analyses contained within our content are rendered as of the date of the posting and may change without notice. The material is not intended as a complete analysis of every material fact regarding any country, region, market, industry, investment or strategy. This information is intended for US residents only.
Disclosure: Interactive Brokers Third Party
Information posted on IBKR Campus that is provided by third-parties does NOT constitute a recommendation that you should contract for the services of that third party. Third-party participants who contribute to IBKR Campus are independent of Interactive Brokers and Interactive Brokers does not make any representations or warranties concerning the services offered, their past or future performance, or the accuracy of the information provided by the third party. Past performance is no guarantee of future results.
This material is from Investopedia and is being posted with its permission. The views expressed in this material are solely those of the author and/or Investopedia and Interactive Brokers is not endorsing or recommending any investment or trading discussed in the material. This material is not and should not be construed as an offer to buy or sell any security. It should not be construed as research or investment advice or a recommendation to buy, sell or hold any security or commodity. This material does not and is not intended to take into account the particular financial conditions, investment objectives or requirements of individual customers. Before acting on this material, you should consider whether it is suitable for your particular circumstances and, as necessary, seek professional advice.
Disclosure: Bonds
As with all investments, your capital is at risk.
Disclosure: ETFs
Any discussion or mention of an ETF is not to be construed as recommendation, promotion or solicitation. All investors should review and consider associated investment risks, charges and expenses of the investment company or fund prior to investing. Before acting on this material, you should consider whether it is suitable for your particular circumstances and, as necessary, seek professional advice.
Disclosure: Futures Trading
Futures are not suitable for all investors. The amount you may lose may be greater than your initial investment. Before trading futures, please read the CFTC Risk Disclosure. A copy and additional information are available at the Warnings and Disclosures section of your local Interactive Brokers website.


Join The Conversation
If you have a general question, it may already be covered in our FAQs page. go to: IBKR Ireland FAQs or IBKR U.K. FAQs. If you have an account-specific question or concern, please reach out to Client Services: IBKR Ireland or IBKR U.K..
Visit IBKR U.K. Open an IBKR U.K. Account