


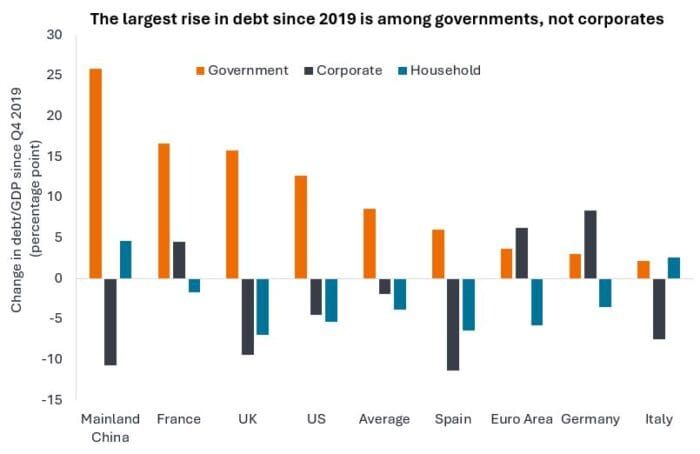

Originally Posted, 11 August 2025 – Chart to Watch: Is government debt helping corporate credit?
James Briggs, Fixed Income Portfolio Manager, highlights the divergence between government and corporate debt levels and the interplay between the two.
Key takeaways:
- The rise in debt levels as a percentage of gross domestic product has principally been due to government borrowing, with corporate debt on average declining since 2019.
- Government spending finds its way into the corporate side of the economy, either directly through expenditure on goods and services or indirectly through wages that are then spent, boosting corporate revenues.
- Reasonably healthy corporate finances and strong investor appetite needs to be balanced against tight valuations, arguing for an increasingly selective approach to investing in corporate credit.
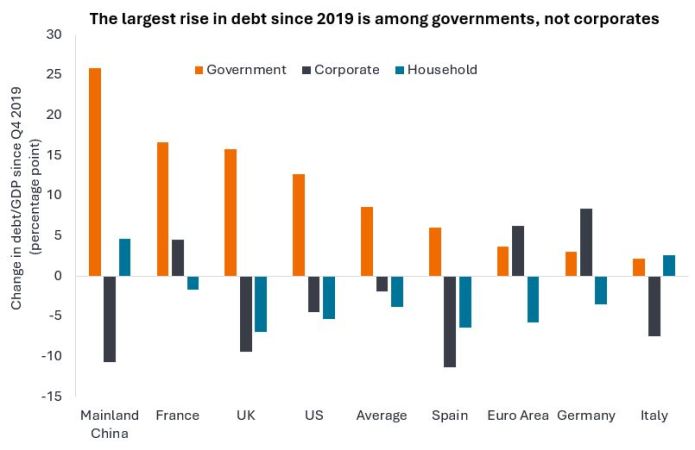
Source: HSBC, BIS, IIF, national statistical agencies. Until Q4 2024, except governments (Q3 2024) and corporates and households for UK and China (Q3 2024). Gross domestic product (GDP) is a measure of the size of the economy.
Companies spent much of the last few years repairing their balance sheets, aided by relatively strong earnings. In some ways the resilience of corporates is partly related to the largesse of governments. The chart above shows the shift in debt burden towards governments and generally away from corporates and households.
In the US, the passing of the Big Beautiful Bill Act is forecast to add an additional US$2 trillion to US government borrowing between 2025-29.1 In the UK, tax raising has been offset by higher welfare spending and public sector pay. In Germany, the government has proposed a big increase in infrastructure and defence spending. Anything that increases spending in the economy is likely to be supportive for corporates. Earnings have been robust and credit spreads (the difference in yield between a corporate bond and a government bond of similar maturity) are near their lows as companies, on average, have reasonably healthy finances.2 In contrast, heavy government borrowing is leading to questions around debt sustainability and has contributed to yields on government debt (particularly longer-term debt of 10+ years to maturity) remaining high.
The question for markets is will governments seek to balance revenues and spending any time soon? On one side of the ledger, lower borrowing might bring down government bond yields, on the other side, it might remove a useful stimulant to the economy. For now, corporate credit is happy for governments to keep the spending taps open.
“Movements in government bond yields can affect returns in credit markets so we need to pay attention to factors such as debt levels that can affect yields. Corporate bond markets have performed well in recent years and there has been strong appetite for credit from investors seeking a yield pick-up over government bonds. With credit spreads at relatively low levels, however, this leaves less margin for error, so we believe it is increasingly important to be selective about which credits to hold in a portfolio.”
– James Briggs, Fixed Income Portfolio Manager.
1Source: US Congressional Budget Office, estimate effects, 29 June 2025.
2Source: Bloomberg, ICE BofA, Morgan Stanley, credit spreads to governments, range over the last 20 years, 28 July 2025. Past performance does not predict future returns.
Disclosure: Janus Henderson
The opinions and views expressed are as of the date published and are subject to change without notice. They are for information purposes only and should not be used or construed as an offer to sell, a solicitation of an offer to buy, or a recommendation to buy, sell or hold any security, investment strategy or market sector. No forecasts can be guaranteed. Opinions and examples are meant as an illustration of broader themes and are not an indication of trading intent. It is not intended to indicate or imply that any illustration/example mentioned is now or was ever held in any portfolio. Janus Henderson Group plc through its subsidiaries may manage investment products with a financial interest in securities mentioned herein and any comments should not be construed as a reflection on the past or future profitability. There is no guarantee that the information supplied is accurate, complete, or timely, nor are there any warranties with regards to the results obtained from its use. Past performance is no guarantee of future results. Investing involves risk, including the possible loss of principal and fluctuation of value.
Disclosure: Interactive Brokers Third Party
Information posted on IBKR Campus that is provided by third-parties does NOT constitute a recommendation that you should contract for the services of that third party. Third-party participants who contribute to IBKR Campus are independent of Interactive Brokers and Interactive Brokers does not make any representations or warranties concerning the services offered, their past or future performance, or the accuracy of the information provided by the third party. Past performance is no guarantee of future results.
This material is from Janus Henderson and is being posted with its permission. The views expressed in this material are solely those of the author and/or Janus Henderson and Interactive Brokers is not endorsing or recommending any investment or trading discussed in the material. This material is not and should not be construed as an offer to buy or sell any security. It should not be construed as research or investment advice or a recommendation to buy, sell or hold any security or commodity. This material does not and is not intended to take into account the particular financial conditions, investment objectives or requirements of individual customers. Before acting on this material, you should consider whether it is suitable for your particular circumstances and, as necessary, seek professional advice.


Join The Conversation
If you have a general question, it may already be covered in our FAQs page. go to: IBKR Ireland FAQs or IBKR U.K. FAQs. If you have an account-specific question or concern, please reach out to Client Services: IBKR Ireland or IBKR U.K..
Visit IBKR U.K. Open an IBKR U.K. Account