


Once again, we see a now-familiar pattern re-emerging. US index futures sell off sharply overnight, recover somewhat as domestic traders rub the sleep from their eyes to find the “buy” buttons on their screens, then after a bit of nervousness around the open, ever-hopeful dip buyers step in after the initial selling. Today that is occurring amidst sharp backwardation in both oil and VIX. It’s easy to note that rallies tend to emerge from the latter condition – the more difficult part is the timing.
Once again, we see the push/pull between the real-world issues causing higher oil prices, inflation concerns, and growth fears versus the undercurrent of FOMO that keeps an underlying bid in US stocks and hence keeps the losses from being catastrophic. We’ve had a major “black swan” event – the closure of the Straits of Hormuz – but stock markets have barely flinched (SPX -2.2% year-to-date counts as barely flinching) because people remain as focused, if not more, on buying dips and not missing rallies than they are about existential concerns for risk. FOMO, or “Fear Of Missing Out”, is labeled as fear, but it’s really greed, and I would assert that there is still plenty of greed out there relative to fear.
I offer the following chart as evidence of that premise. Note that in the six trading days since the Iran conflict began, we have seen stocks bounce sharply off early lows. The lone exception was Friday, which I described as a decent day, under the circumstances, when traders seemed to think twice about going home with long positions ahead of the weekend. Note the bounces on the first four days of last week and so far today:
SPX, 6-Days, 2-Minute Candles

Source: Interactive Brokers – Past performance is not indicative of future results.
This morning’s bounce comes alongside some relatively extreme backwardation in oil and volatility. Backwardation occurs when near-term futures trade with higher prices than those of their longer-term counterparts. The more normal situation, contango, shows longer-term futures rising relative to shorter-term contracts. Contango reflects normal conditions of supply and demand, alongside an upward-sloping yield curve. Backwardation tends to imply a relative shortage of the commodity in question in the near-term, though with conditions improving eventually.
Oil futures are one of the few that typically trade in backwardation. That is a result of supply conditions and the cost of storage, among other factors. That said, we have seen oil move into extreme backwardation this week.
Term Structure of Rolling Front-Month WTI Futures, Today (green), 1-Week Ago (red), 1-Month Ago (purple), with Changes vs. Today (bottom)
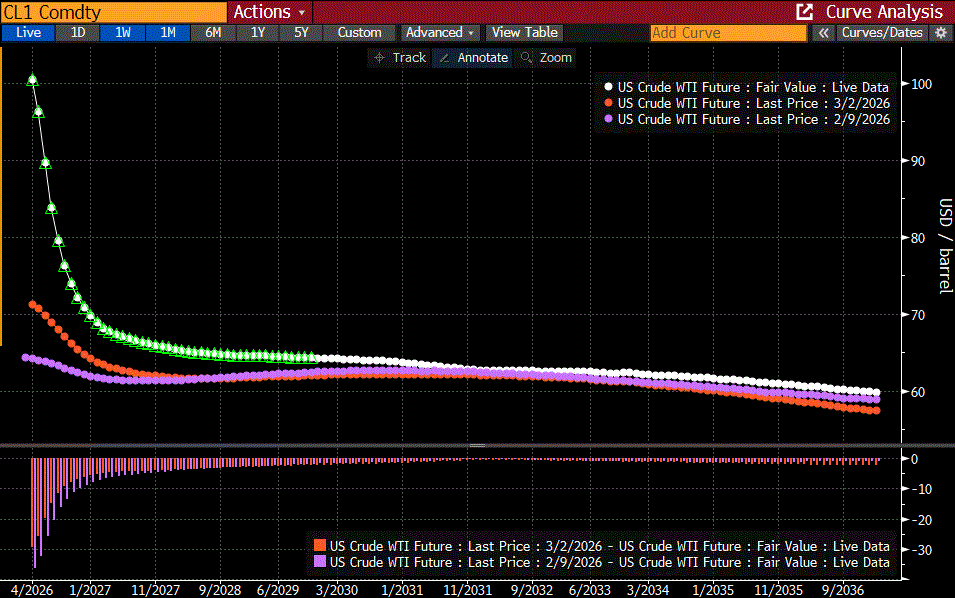
Source: Bloomberg – Past performance is not indicative of future results.
Note that one month ago, we had a flattish oil futures curve, with modest backwardation in the front, some contango about 5 years out, then a return to backwardation. We saw that backwardation increase after the start of hostilities and become extreme today – even though we are well off our overnight highs for that product. Importantly, we still see futures markets expecting prices above $70/barrel for several months. Even a quick end to the closure of the Straits implies that supply headaches could take some time to iron out.
Looking at VIX (Cboe Volatility Index), we see significant backwardation as well. That implies a shortage of available volatility protection amidst demand from hedgers, with a return to more normal conditions in a few months. Even so, the curve is quite elevated relative to one-month-ago, and even one-week-ago.
Term Structure of VIX Futures, Today (white), 1-Week Ago (red), 1-Month Ago (purple), with Changes vs. Today (bottom)
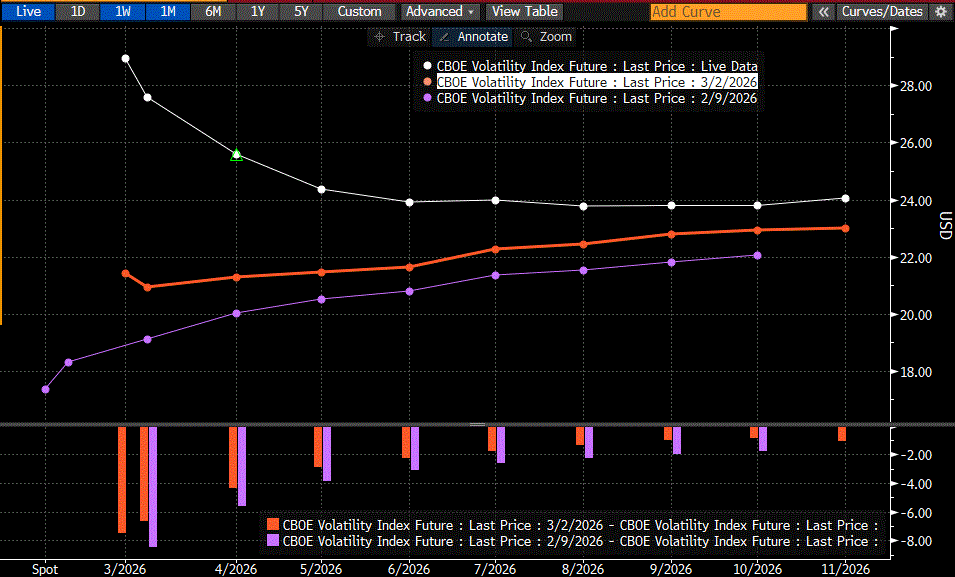
Source: Bloomberg – Past performance is not indicative of future results.
Note that VIX is actually down today after flirting with a 30 close on Friday and trading above 35 this morning. As noted earlier, big rallies often occur after the VIX curve inverts dramatically. The backwardation is perceived as a bit of panic, and that situation tends to resolve itself eventually.
But when? Realize that VIX can and does tend to go much higher during crises. Bearing in mind that the current selloff is barely a blip, let alone a correction or flirtation with bear market levels, we can compare the current state of backwardation with the levels we saw last April in the aftermath of “Liberation Day.” Stock traders are banking on a quick end to the Iran conflict and reopening of the Straits. If not, here is the sort of backwardation that could result:
Term Structure of VIX Futures, Today (white), 1-Week Ago (red), 1-Month Ago (purple), April 17th, 2025 (yellow), April 7th, 2025 (blue) with Changes vs. Today (bottom)
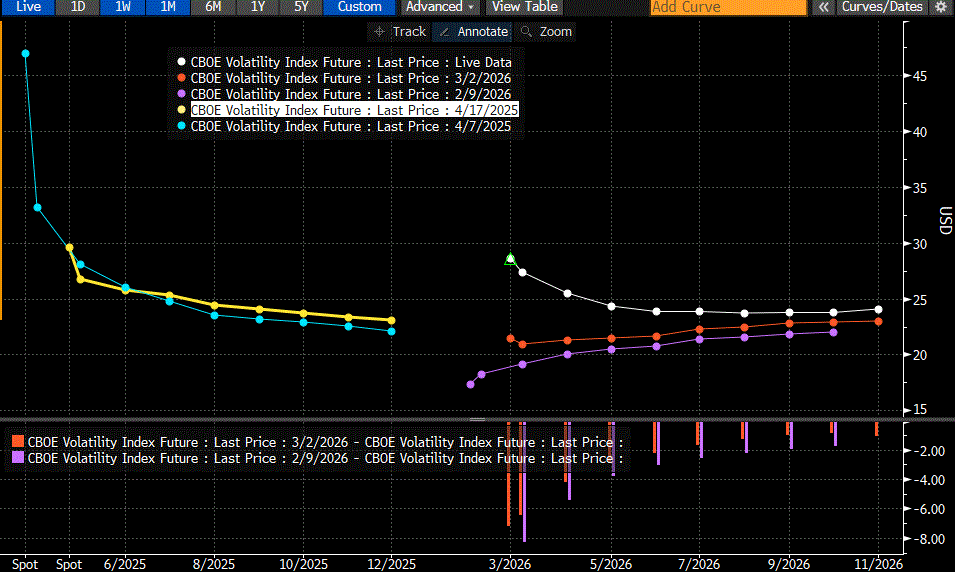
Source: Bloomberg – Past performance is not indicative of future results.
New to Interactive Brokers?
Open AccountAlready an Interactive Brokers Client?
Request Trading PermissionDisclosure: Interactive Brokers
The analysis in this material is provided for information only and is not and should not be construed as an offer to sell or the solicitation of an offer to buy any security. To the extent that this material discusses general market activity, industry or sector trends or other broad-based economic or political conditions, it should not be construed as research or investment advice. To the extent that it includes references to specific securities, commodities, currencies, or other instruments, those references do not constitute a recommendation by IBKR to buy, sell or hold such investments. This material does not and is not intended to take into account the particular financial conditions, investment objectives or requirements of individual customers. Before acting on this material, you should consider whether it is suitable for your particular circumstances and, as necessary, seek professional advice.
The views and opinions expressed herein are those of the author and do not necessarily reflect the views of Interactive Brokers, its affiliates, or its employees.
Disclosure: Futures Trading
Futures are not suitable for all investors. The amount you may lose may be greater than your initial investment. Before trading futures, please read the CFTC Risk Disclosure. A copy and additional information are available at the Warnings and Disclosures section of your local Interactive Brokers website.


Join The Conversation
If you have a general question, it may already be covered in our FAQs page. go to: IBKR Ireland FAQs or IBKR U.K. FAQs. If you have an account-specific question or concern, please reach out to Client Services: IBKR Ireland or IBKR U.K..
Visit IBKR U.K. Open an IBKR U.K. Account