


Risk off sentiments continue to grip Wall Street as Apple’s beat-and-raise last night failed to reignite AI excitement and is therefore leading to another session of tech shares underperforming broader equities. But conditions in stocks are much better than they were overnight, as futures sold off aggressively subsequent to the nomination of former Fed Governor Kevin Warsh to lead the central bank after the culmination of Chair Powell’s term in May. Warsh is historically a hawk and has maintained an orthodoxy throughout his career of disciplined monetary policy characterized by higher real rates and a limited balance sheet; however, he has tilted toward President Trump’s preference of lower borrowing costs recently and that may have very well have granted him the selection. The greenback is rallying against the backdrop, because the new chief, if confirmed, has the strongest chance among the candidates of assuming a confrontational posture as it relates to the White House’s desire for a less restrictive stance. The “Buy America” trade is back as a result, and the independence bid that drove gold and silver to nosebleed record heights right below $5,600 and $122 per ounce early yesterday morning is unraveling, with the precious metals diving to nearly as low as $4,900 and $90 only a day later. Copper is getting punished too in the wake of reaching an all-time high of its own. The yield curve is steepening, meanwhile, as almost two cuts for this year remain priced in, helping the shorter tenors notch gains; nonetheless, the long-end is suffering modest losses, as Warsh’s inclination for less, and not more, fixed-income instruments on the institution’s financial statements quells enthusiasm regarding quantitative easing prospects. Pricier duration is also stemming from a hotter-than-expected PPI print, and that’s hurting the cyclical aspects of the market, as just 3 of the major 11 sectors are advancing following an interval where we saw an optimistic broadening.
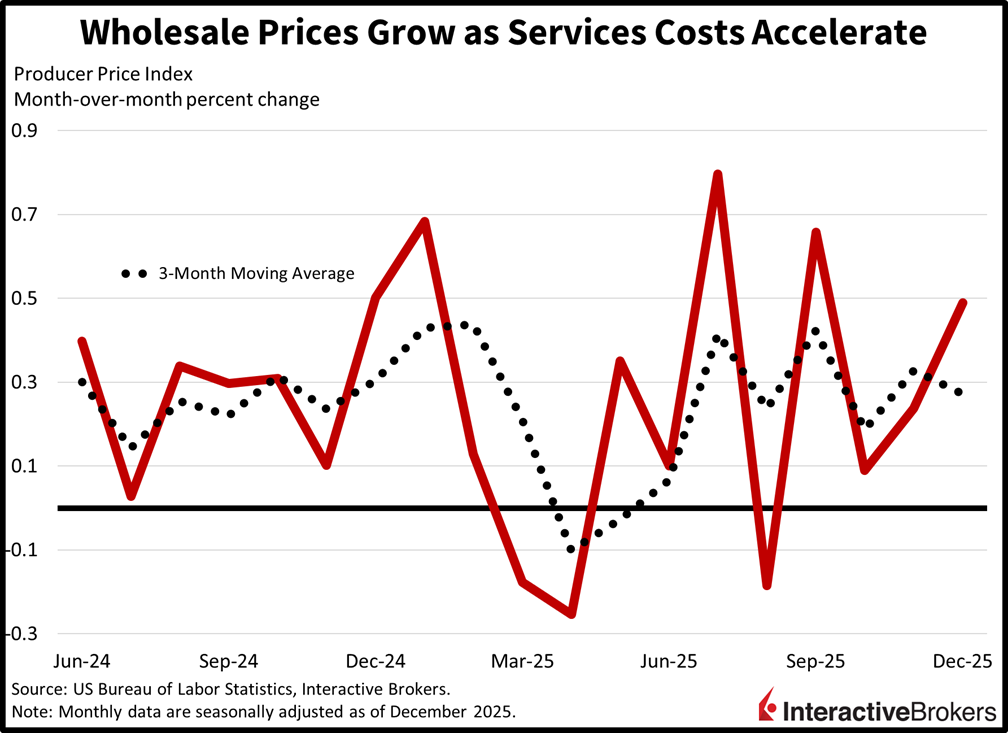
Producer Price Index Climbs More than Expected
The strongest services cost pressures since July drove a significant beat in December’s Producer Price Index (PPI). The headline reading climbed 0.5% month over month (m/m) and 3% year over year (y/y), stronger than the 0.2% and 2.7% expected. In November, the gauge was up 0.2% m/m and 3% y/y. Under the hood, core goods rose 0.4% last month while food and energy offered relief, declining 0.3% and 1.4% during the period. Services experienced broad hikes, however, with the overall 0.7% rise being supported by 1.7%, 0.5% and 0.3% increases from trade, transportation/warehousing and the other category.
Past performance is not indicative of future results
Housing Disinflation Trumps PPI
A deceleration in home values and rental costs across the country on the back of cratering population growth is poised to continue putting downward pressure on inflation. Housing comprises north of 40% of the Consumer Price Index (CPI) and an ongoing alleviation there can offset the recent surge in energy stickers as well as any unexpected acceleration in the services and/or goods areas. The fundamental driver of slowing shelter inflation is the domestic population expansion braking to a crawl, as aging dynamics, declining births and restrictive immigration pose significant headwinds to household formation, weighing on residential closings and leases. These impacts are of substantially increased importance to the overall picture than tariffs, and/or robust shopper demand driving up charges, and while they don’t bode positively for longer term GDP potential, they are deflationary. Meanwhile, Japan, the EU and China are experiencing even more severe demographic issues, providing lessons regarding future risks for the US.
International Roundup
South Korea’s Industrial Output Down from Year-Ago Period
South Korea’s industrial output in December grew faster than expected but was still below the year-ago level, according to the Ministry of Data and Statistics. Output grew 1.7% m/m, significantly beating the economist consensus estimate for a 0.4% expansion while accelerating from November’s 0.8% growth. Production, however, was down 0.3% from the year-ago period, which was a less severe drop than both November’s 1.2% decline and the economist consensus forecast for a 2.1% contraction. The broader Index of All Industry Production, furthermore, was up 1.5% m/m, but down 1.8% y/y. Within this gauge, the services component was up 3.7% y/y while construction, manufacturing and public administration sank 4.2%, 0.4% and 0.1%.
In other matters, the country’s Retail Sales Index depicted cash register activity ascended 0.9% m/m and 1.2% y/y while the Equipment Investment Index climbed 3.7% and 10.3% m/m and y/y.
Japan’s Retail Sales Slipped Last Month
Sales among large Japanese retailers in December slipped 2% m/m but were still 2% higher than during December 2024. The monthly drop follows a 0.7% gain in November, but the y/y print depicts decelerating growth following the preceding month’s 5% ascent. On a broader basis, overall cash register transactions slipped 0.9% y/y. Economists anticipated a 0.7% improvement following November’s 1.1% expansion.
But Industrial Production and Construction Orders Strengthen
Construction orders in Japan during the last month of 2025 were 20.2% higher than in the year-ago period, a considerable gain after November’s 9.5% growth. Meanwhile, groundbreaking for housing projects sank 1.3%, a marked improvement from the 8.5% y/y collapses in November and the economist consensus for volume to descend 4.5%. Industrial production, furthermore, climbed 0.8% last year, a reversal from three years of declines. The positive result was helped by output of electronics and automobiles.
Hong Kong GDP Up 3.8% Y/Y
Hong Kong’s gross domestic product grew at an annualized rate of 3.8% in the final quarter of 2024, according to a preliminary estimate from the special administrative region’s Census and Statistics Department. On a quarter-over-quarter basis, the economy is estimated to have grown 1% after a 0.7% expansion during the three-month period ended in September.
Disclosure: Interactive Brokers Affiliate
Information posted on IBKR Campus that is provided by third-parties does NOT constitute a recommendation that you should contract for the services of that third party. Third-party participants who contribute to IBKR Campus are independent of Interactive Brokers and Interactive Brokers does not make any representations or warranties concerning the services offered, their past or future performance, or the accuracy of the information provided by the third party. Past performance is no guarantee of future results.
This material is from IBKR Macroeconomics, an affiliate of Interactive Brokers LLC, and is being posted with its permission. The views expressed in this material are solely those of the author and/or IBKR Macroeconomics and Interactive Brokers is not endorsing or recommending any investment or trading discussed in the material. This material is not and should not be construed as an offer to buy or sell any security. It should not be construed as research or investment advice or a recommendation to buy, sell or hold any security or commodity. This material does not and is not intended to take into account the particular financial conditions, investment objectives or requirements of individual customers. Before acting on this material, you should consider whether it is suitable for your particular circumstances and, as necessary, seek professional advice.
Disclosure: Precious Metals
Precious metals may not be available in all locations, please check your local IBKR website for availability.


Join The Conversation
If you have a general question, it may already be covered in our FAQs page. go to: IBKR Ireland FAQs or IBKR U.K. FAQs. If you have an account-specific question or concern, please reach out to Client Services: IBKR Ireland or IBKR U.K..
Visit IBKR U.K. Open an IBKR U.K. Account