


A weekend escalation in US-Iran tensions featured a failure to seal a deal in Islamabad, which led to President Trump sending the American Navy to block the Strait of Hormuz. With both sides still very far apart from an agreement, stocks and Treasuries suffered deep overnight losses before climbing back into the green prior to the opening bell. WTI trading above $105 a barrel was a substantial signal for investors to cut risk in response to heightening geopolitical angst amidst worries that supplies won’t make it to key Asian export destinations, including China, Japan and South Korea. But Pakistani officials remain committed to try and bring Washington and Tehran closer to a truce, and that motivated market participants to dive in and buy the dips in equities and bonds. Asset prices have fluctuated meaningfully, and now the Russell 2000 and Nasdaq 100 benchmarks are advancing while the Dow Jones and S&P 500 indices retreat against the backdrop of most sectors declining minus technology, energy and financials. Yields, the greenback is rising slightly while commodities are mixed, with crude, natural gas, and copper ascending while silver, gold and lumber descend as sliding odds for rate reductions weigh on those materials. Defensive winds blowing throughout Wall Street have folks adding hedges as premiums on volatility protection instruments increase.
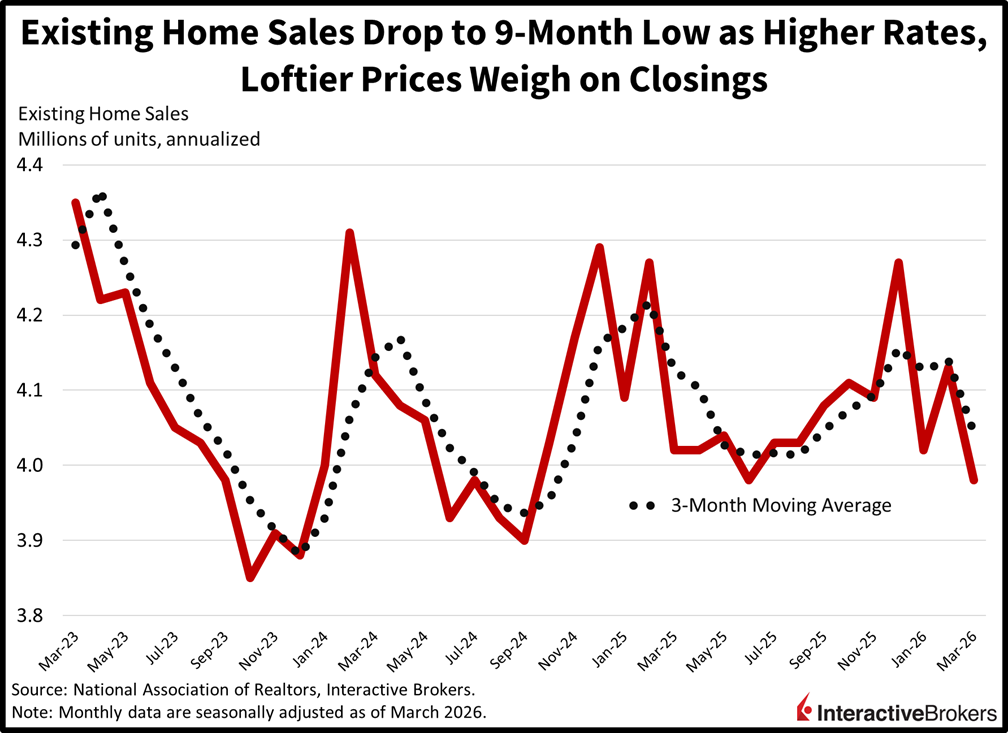
Real Estate Sales Hit Slowest Pace Since June
Residential real estate transactions dove to their slowest pace since June last month, as elevated mortgages rates and growing valuations weighed on affordability. The 3.98 million seasonally adjusted annualized units marked a 3.6% month-over-month (m/m) decline. Additionally, it arrived beneath the 4.06 million expected and the 4.13 million from February. All regions posted contractions with the Northeast, Midwest, South and West decreasing 8.5%, 4.2%, 3.1% and 1.3% m/m. The larger single-family segment’s 0.3% m/m drop was modest compared to the condominium/cooperative category tanking 5.4% m/m. Overall, prices grew 1.4% year over year (y/y) while inventory was up to 1.36 million units, rising 3% m/m and 2.3% y/y. Despite the lift in supply, housing stock remains depressed relative to historical norms and that, on top of lofty costs and heavy financing charges, are weakening the outlook for the sector, which is in its fourth consecutive year of recession.
Past performance is not indicative of future results.
Weakening Fundamentals Have Investors Reaching for Tech
Today’s narrow stock performance features investors reaching for tech shares as weakening economic fundamentals weigh on buyer engagement in most of the other equity sectors. Participants want to be shareholders of companies that can weather elevated interest rates, climbing oil prices and a cyclical slowdown. The Magnificent 7 names match these criteria and are supporting the recovery on Wall Street from the overnight lows this morning, as profit expectations for this group are rising disproportionately relative to separate equity categories. But with earnings season almost in full swing and assets vulnerable to Washington-Tehran headlines, the bar is high for the overall market to rally significantly, even as valuations have become more accommodative. Furthermore, upcoming quarterly calls will provide significant details on how corporate margins are projected to hold up in a challenging environment of heavy fuel costs, pricier borrowing charges and tariff pressures amidst rate cut prospects that appear distant at best, as fixed-income watchers consider only a 22% chance of a single 25-basis point reduction by year-end.
International Roundup
Jump in Chinese Debt Issuance Misses Expectations
The total value of loans extended to consumers and businesses in China increased by 2.99 trillion yuan, or $438 billion, in March, up significantly from 900 billion yuan in the preceding month but lower than the economist consensus estimate of 3.465 trillion. It was also down from the January jump of 4.710 billion yuan. Loan growth has been curtailed by the country’s glut of housing. Total social financing, which measures shadow banking by including loans for households along with debt issued by domestic institutions, meanwhile, climbed 7.9% y/y in March to 456.46 yen.
Canada Building Permits Sink
The volume of building permits as measured by the value of planned construction projects in Canada fell by $1.1 billion, or 8.4%, m/m to $12.1 billion in February, according to Statistics Canada. Economists anticipated a 0.4% contraction following the 3.5% ascent in January. The value of residential sector projects that received permits in February climbed by $135.6 million, but the gain didn’t fully offset the $1.3 billion drop in the non-residential category. In the non-residential category, the institutional group led the weakness, dropping by $987 million. The value of projects that were issued permits for commercial and industrial buildings, furthermore, slipped by $160 million and $104.7 million.
Disclosure: Interactive Brokers Affiliate
Information posted on IBKR Campus that is provided by third-parties does NOT constitute a recommendation that you should contract for the services of that third party. Third-party participants who contribute to IBKR Campus are independent of Interactive Brokers and Interactive Brokers does not make any representations or warranties concerning the services offered, their past or future performance, or the accuracy of the information provided by the third party. Past performance is no guarantee of future results.
This material is from IBKR Macroeconomics, an affiliate of Interactive Brokers LLC, and is being posted with its permission. The views expressed in this material are solely those of the author and/or IBKR Macroeconomics and Interactive Brokers is not endorsing or recommending any investment or trading discussed in the material. This material is not and should not be construed as an offer to buy or sell any security. It should not be construed as research or investment advice or a recommendation to buy, sell or hold any security or commodity. This material does not and is not intended to take into account the particular financial conditions, investment objectives or requirements of individual customers. Before acting on this material, you should consider whether it is suitable for your particular circumstances and, as necessary, seek professional advice.
Disclosure: Futures Trading
Futures are not suitable for all investors. The amount you may lose may be greater than your initial investment. Before trading futures, please read the CFTC Risk Disclosure. A copy and additional information are available at the Warnings and Disclosures section of your local Interactive Brokers website.
Disclosure: Precious Metals
Precious metals may not be available in all locations, please check your local IBKR website for availability.


Join The Conversation
If you have a general question, it may already be covered in our FAQs page. go to: IBKR Ireland FAQs or IBKR U.K. FAQs. If you have an account-specific question or concern, please reach out to Client Services: IBKR Ireland or IBKR U.K..
Visit IBKR U.K. Open an IBKR U.K. Account