


 Client Portal – Trading and Advanced Functions (Cantonese)")
 Utilizing Simple Options Trading Strategies (Dutch)")


Markets are mixed to start the week as last Friday’s Jackson Hole enthusiasm tempers and participants turn their focus to a critical earnings report from AI-juggernaut Nvidia this Wednesday afternoon. The semiconductor behemoth has powered the stock market’s run since late 2023 and investors are patiently awaiting the firm’s outlook to gauge how much further the rally can go. Today’s trading lacks catalysts, however, which explains much of the muted sentiment throughout the indices, although rate sensitive, cyclically oriented areas are underperforming. Part of that sluggishness results from traders re-evaluating Chair Powell’s dovishness. Indeed, fixed-income players are paring back some of the Treasury compound’s gains following the Fed Chief’s speech in a sign of reduced optimism, as the yield curve ascends in bear-flattening fashion led by the short-end. While folks are generally in consensus about a September cut, October and December are still live, data-dependent meetings. The stateside economic calendar was quiet, but new home sales came out at 10:00 am and depicted continued weakness in residential real estate, evidenced by significant concessions and price discounts on behalf of builders amidst lighter valuations and bleak trends. Elsewhere, the dollar is gaining on heavier domestic borrowing costs, volatility protection instruments are catching bids, commodities are advancing across the board. In equities, the Nasdaq 100 and S&P 500 are appreciating 0.1% each, but the Dow Jones Industrial and Russell 2000 are both retreating by 0.5%.
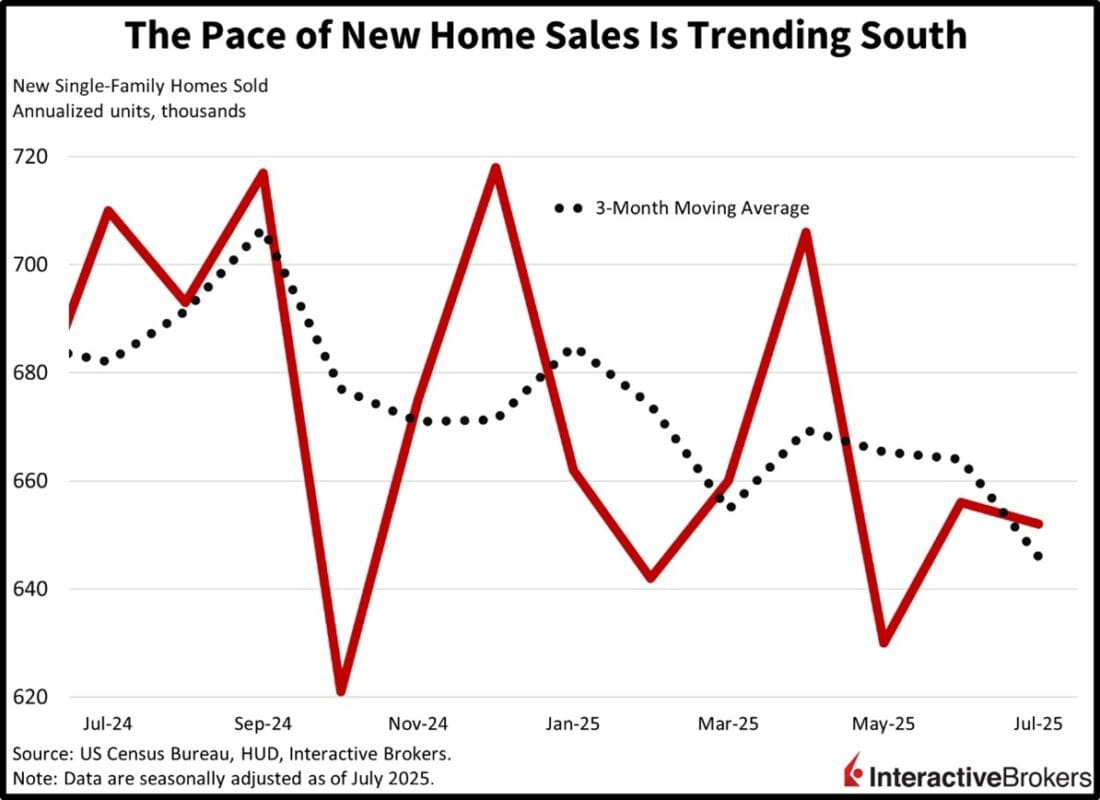
New Home Sales Remain Weak
The pace of new home sales weakened in July despite homebuilders offering concessions and discounts. The rate of transactions fell 0.6% month over month (m/m) to 652,000 seasonally adjusted annualized units (SAAU) last month, surpassing expectations for 635,000 but slightly below June’s 656,000. Momentum was unchanged in the Northeast but sank 6.6% and 3.5% in the Midwest and South. The West was an outlier, with closings up 11.7%. Both the median and average values dropped, falling from $407,200 and $505,300 to $403,800 and $487,300. Valuations were also down on a year over year (y/y) basis with declines of 5.9% and 5%. The monthly supply inventory ratio was flat from the previous month at 9.2, however.
Investors Focus on Nvidia’s Wednesday Report
Top of mind for Wall Street is Nvidia’s upcoming earnings report as the artificial intelligence theme has been a dominant factor leading to appreciating equity prices. Stocks would not have experienced two back-to-back years of returns exceeding 20% had it not been for the significant progress in the space. And while great investment performances are terrific, they have presented the risks of reliance and concentration to the landscape. Indeed, the market heavily depends on the magnificent 7 and especially Nvidia and ongoing AI growth to continue posting spectacular numbers amidst an environment of elevated valuations. But a broadening would prove meaningfully beneficial, and the path would widen greatly with a few Fed cuts helping the increasingly vulnerable components and bolstering the S&P 500 to a finish amounting to the third consecutive annual gain over 20%. Still, though, the Russell 2000 remains below its November 2021 high.
International Roundup
Singapore Prices Decline Month Over Month
Singapore experienced its second consecutive print of m/m deflation in July, but overall costs were still up relative to the same period in 2024. The island nation’s Consumer Price index fell 0.4% m/m last month after dropping 0.1% in June. When excluding housing, the gauge sank 0.6% following the preceding month’s 0.1% drop. Conversely, the y/y headline was up 0.6%, easing slightly from 0.8% in June and lower than the 0.7% economist consensus estimate. The core version eased from 0.6% to 0.5%.
Relative to the preceding month, prices dropped 2.6% and 1.6% for the clothing and footwear group and the housing and utilities category. The health category descended 0.2% while information and communication was down 0.1%. The largest increase occurred with the recreation, sport and culture group, the food sector and transportation, with gains of 0.3%, 0.2% and 0.2%.
Japan’s Leading Indicator Strengthens
Japan’s Leading Index strengthened in June, climbing from 104.8 to 105.6 but it missed the economist consensus estimate of 106.1. In a similar manner, the Coincident Indicator climbed 0.7% m/m after being flat in May. Economists anticipated a 0.8% gain.
Canada Profits Fall Relative to First Quarter
Corporate profits in Canada last quarter sank 1.7% compared to the first quarter, but were still up 1.6% y/y. Of the 39 non-financial industries tracked by Statistics Canada, 13 experienced m/m earnings declines but the financial sector produced a 0.9% gain, a reversal from the past two quarters of weaker performance.
Of the 14 manufacturing categories, five reported q/q drops. More broadly, industries with significant contractions and the extent of the changes were as follows:
- Motor vehicle and trailer manufacturing, 70%. Results were hurt by several assembly plants partially shutting down in response to uncertainty over US tariffs.
- Petroleum and coal manufacturing, 38.1%. Lower prices for refined hydrocarbon products dinged earnings.
- Oil and gas industry, 26.2%. Softness in oil prices, lower export volumes and wildfire related production shutdowns caused the weakness.
- Transportation pipeline industry, 17.3%. A rapture in the US oil distribution network caused a decline in demand within this sector.
The retail sector bucked the broader trend, posting a 4.4% gain. Within this sector, clothing, sporting goods, and general merchandise stores profits climbed 9.1%, driven by a 2.5% jump in operating revenue. The financial sector’s positive 0.9% result, meanwhile, was powered by property and casualty insurance carriers growing their earnings by 26.8% with favorable weather causing fewer claims.
Disclosure: Interactive Brokers Affiliate
Information posted on IBKR Campus that is provided by third-parties does NOT constitute a recommendation that you should contract for the services of that third party. Third-party participants who contribute to IBKR Campus are independent of Interactive Brokers and Interactive Brokers does not make any representations or warranties concerning the services offered, their past or future performance, or the accuracy of the information provided by the third party. Past performance is no guarantee of future results.
This material is from IBKR Macroeconomics, an affiliate of Interactive Brokers LLC, and is being posted with its permission. The views expressed in this material are solely those of the author and/or IBKR Macroeconomics and Interactive Brokers is not endorsing or recommending any investment or trading discussed in the material. This material is not and should not be construed as an offer to buy or sell any security. It should not be construed as research or investment advice or a recommendation to buy, sell or hold any security or commodity. This material does not and is not intended to take into account the particular financial conditions, investment objectives or requirements of individual customers. Before acting on this material, you should consider whether it is suitable for your particular circumstances and, as necessary, seek professional advice.


Join The Conversation
If you have a general question, it may already be covered in our FAQs page. go to: IBKR Ireland FAQs or IBKR U.K. FAQs. If you have an account-specific question or concern, please reach out to Client Services: IBKR Ireland or IBKR U.K..
Visit IBKR U.K. Open an IBKR U.K. Account