By: US Multi-Sector Fixed Income
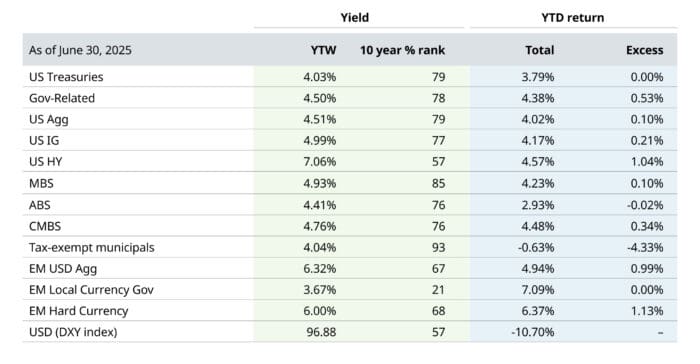
The investment industry often uses hyperbole, but it is no exaggeration to say that the first half of 2025 was an unprecedented period. We had arguably the largest upheaval to the global trading system in 100 years. Stock market volatility approached an all-time high. The dollar suffered the largest first half of the year depreciation that it has seen in 50 years. Further uncertainty came from the extended negotiations over a major piece of spending and tax legislation, the “One Big Beautiful Bill,” which ultimately passed in early July. Despite this backdrop, fixed income returns were solid for the first half of the year (Figure 1). As we have mentioned many times previously, the starting point in yields really does matter to prospective returns.
Figure 1: Total returns for 2025 have been solid for most sectors, with yields at attractive levels
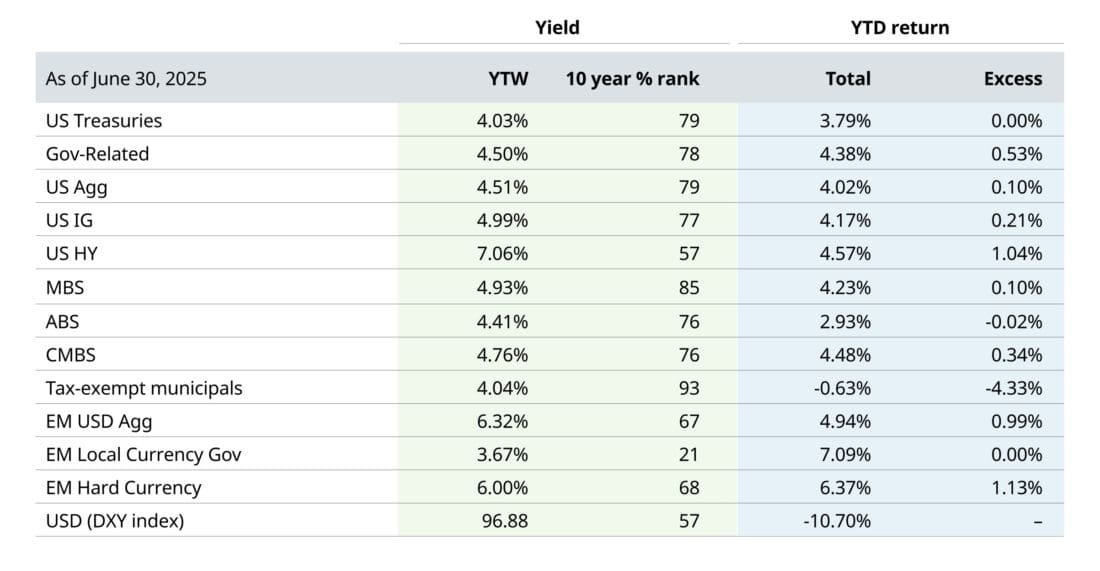
Indices used are the Bloomberg U.S. Treasury Index, Bloomberg US Aggregate: Government Related Index, Bloomberg U.S. Aggregate Index, Bloomberg U.S. Corporate Index, Bloomberg Corporate High Yield Index, Bloomberg US Mortgage-Backed Securities Index, Bloomberg Asset-Backed Securities Index, ICE BofA US Municipal Securities Index, Bloomberg Emerging Markets USD Aggregate Index, Bloomberg Emerging Market Local Currency Government Index, Bloomberg Emerging Market Hard Currency Aggregate Index, and US Dollar DXY Index. Past performance is not a guarantee of future results.
US fixed income can offer a combination of attractive valuations, diversification and the potential for capital appreciation. We encourage investors to look beyond the headlines about tariffs, the tenure of Federal Reserve (Fed) Chair Jerome Powell or the prospects of foreign investors selling all their US Treasuries. To state the key point again: the single best predictor in fixed income is the yield you are offered today, and today’s yields stand in a stark contrast to the extreme lows of the initial post-Covid-19 years. At their current levels, yields have become, once more, the most reliable indicator of future returns.
Are the concerns about fiscal policy warranted? Without a doubt, they are. That probably means the trends we have seen this year, including steeper yield curves and a weaker dollar, will persist.
When thinking about fixed income returns, the starting yield matters
Fixed income returns have still not fully recovered the drawdowns from the post-Covid era, and this continues to weigh on investor sentiment. The mediocre fixed income returns that came in the immediate aftermath of 2020 were driven by three primary factors. First, low yields often lead to weak subsequent total returns, both because income is such a critical component of bond returns and the rate increases that often follow periods of low yields bring price declines. During the pandemic, the yield on the 10-year US Treasury touched a low of 0.5%. The situation was even more dire for the $18-trillion worth of global debt, whose yields were negative. The second key factor was inflation jumping up from a generational low. In 2022 and early 2023, the inflation rate peaked at levels that approached—and, in some countries, reached—double digits. The final and third key factor contributing to bonds’ mediocre returns in the early 2020s was central banks’ aggressive response to inflation. That was exemplified by the Fed, which hiked rates from zero to 5.5% in just a 16-month period, from March 2022 to July 2023.
Today’s yields—which are much higher than they were in 2020, 2021 and early 2022—appear to bode well for future fixed income returns. That view is backed by a historical perspective that encompasses six decades and not merely the past several years (Figure 2).
Figure 2: The current starting point in yields is well ahead of where it was in the 2010s and early 2020s
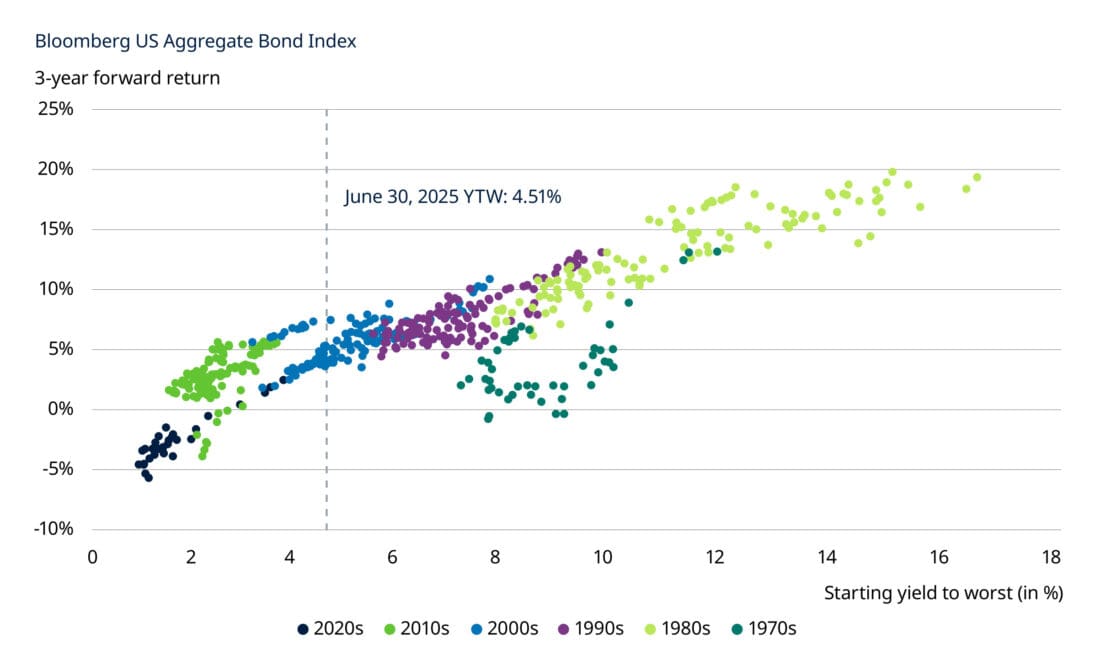
Source: LSEG Datastream, Schroders, as of June 30, 2025. Current performance trends are not a guide to future results and may not continue.
Taking into account deficits, the dollar, tariffs and the One Big, Beautiful Bill
Our review of the second quarter would not be complete without an acknowledgement of the huge number of policy and legislative changes, ranging from tariffs to the One Big Beautiful Bill Act (OBBBA), that could have a significant impact on government deficits, bond markets and the US dollar. There is no doubt that the US has a major debt and budget deficit problem. Inaction on the issue has been a contributing factor to the steepening of yield curves and the fall in the dollar that we have seen this year. While the tariff increases are primarily designed to coax other countries into more favorable trading agreements, they also help the US government address its revenue shortfall. That is seen by the current administration and Congress as more politically palatable than tax increases. (Below we take a closer look at the potential impact of tariffs on the debt and deficits.)
For the US government’s last fiscal year (which runs October 1 to September 30), its interest expense (which tripled over the past four years) exceeded defense spending for the first time since the 1930s. It is now more than 3% of the United States’ gross domestic product (GDP). (See Figure 3.) In fact, Niall Ferguson of the Hoover Institution in a paper published this year suggested, with the invocation of a new rule he coined as “Ferguson’s Law,” that when a great power’s debt spending exceeds its defense spending, it ceases to be one.1
Figure 3: The US government’s interest expense has overtaken its defense spending
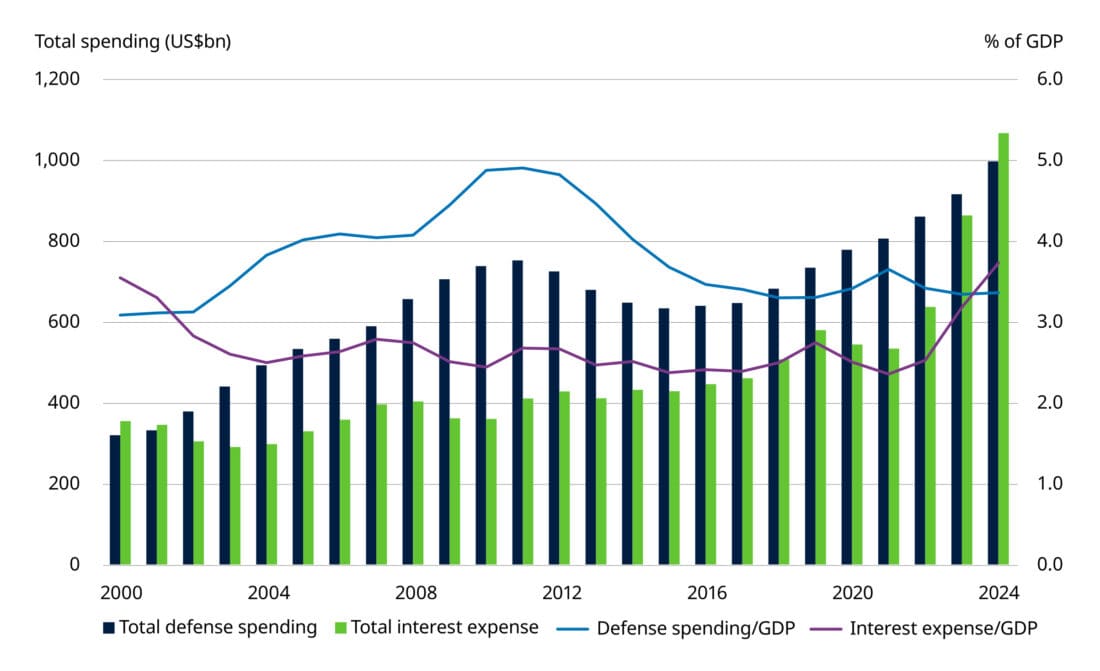
Source: FRED, SIPRI, World Bank, as of December 31, 2024.
The common assumption is that these astronomical levels of debt create runaway inflation and surging bond yields, but the reality may not be so simple. Academic research by economists Carmen Reinhart and Kenneth Rogoff suggests that high government debt is an effective growth destruction mechanism.2 Further, for countries that can print their own currency, higher debt levels can often coincide with lower bond yields.
Solutions to debt problems probably require LOWER, not HIGHER real bond yields. (See Figure 4.) That was the case in the post-World War II era when the United States had similar debt levels, and authorities, particularly in the executive branch and the central bank, took advantage of the several ways (including monetary policy, regulations and direct market intervention) that they have to manipulate yields lower. Structurally, these moves are likely to bring higher inflation and a lower dollar over the medium term, but the key for authorities is to keep nominal bond yields BELOW the nominal growth rates, while covertly deflating the debt burden. The recent performance of gold should be viewed as illustrative in this regard. Gold, which has historically done well in periods of high inflation, low yields and a weak dollar, has soared in value.
Figure 4: High levels of debt lead to lower bond yields
US government debt as a percentage of GDP versus 10-Year US Treasury yields
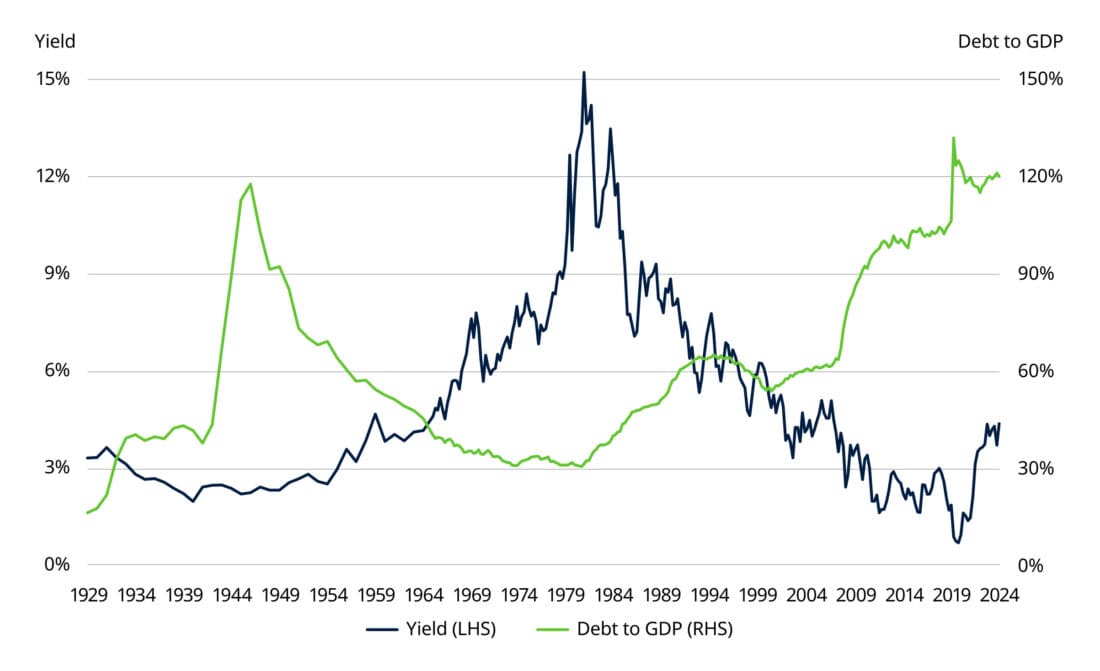
Source: FRED and Robert Shiller (Shillerdata.com) December 31, 2024. Current performance trends are not a guide to future results and may not continue.
What could go right? (Thoughts on tariff revenue and AI-generated productivity gains)
With regard to what, on the surface, seems like a troublesome US fiscal situation, it is important to note there are two factors that could contribute more positively to the debt and deficit picture than the projections made by the Congressional Budget Office (CBO). (In estimating the impact of OBBBA, the CBO forecast mounting debt and deficits as far as the eye can see.) The two key potential positive contributors are tariff revenue and productivity gains generated by artificial intelligence (AI).
Tariff revenue was not taken into account in the CBO’s projections. In June alone, tariff revenue raised $27 billion for the Treasury Department. That is four times higher than it was for the same month in 2024. Although there may be some payment quirks in June, government revenues from April to June 2025 were up $182 billion, an 11.6% increase relative to the same period in 2024. During the second quarter of 2025, government spending, also relative to the second quarter of last year, was broadly flat. The evolution of revenue and spending will be something to closely monitor, especially given how embedded the weak fiscal narrative is.
The second key potential contributor to a more favorable debt and deficit picture is productivity and its impact on growth, which can be a considerable swing factor influencing the direction of debt and deficits. Many of us are already integrating AI into our daily lives, at work and at home, thereby taking advantage of the fact that it enables us to get more done and to do it more quickly. Long-term growth projections are extremely sensitive to changes in productivity. As Figure 5 illustrates, investments in AI capabilities have grown substantially since 2020. If those investments in AI lead to higher productivity, that could have an extremely beneficial impact on growth and change the trajectory of US debt, effectively flattening what has been a steady march upward.
Figure 5: AI spending could positively impact productivity, growth and debt levels

Source: Chart on left: Gartner, as of July 10, 2025. Chart on right: Congressional Budget Office, Deutsche Bank, as of January 17, 2025. Forward-looking views may not materialize.
We recognize that markets operate on expectations, and the fiscal deterioration narrative is already firmly embedded in bond valuations. The fact that the Credit Default Swap spread for US government debt is now similar to Greece’s is a clear indicator of heightened concerns about US fiscal sustainability. The nuanced point we are trying to make here is that any further deterioration in the fiscal trajectory is unlikely to meaningfully drive prices lower, given that the bleakest of scenarios is already expected. Any positive surprises—which might come from tariff revenue or AI-generated productivity gains that deliver strong growth—could cause markets to reprice upward.
While the fixed income opportunity looks compelling, the picture within sectors is more nuanced
While we have articulated a constructive view on the longer-term opportunity within fixed income, we believe investors should proceed more thoughtfully when considering sector allocations. While corporate bonds have become expensive, certain sectors are screening much more attractively and not sending the same signal that risk-taking is not being adequately compensated.
Our chart of spread percentiles over the past decade (Figure 6) shows just how compressed spreads are within the corporate sector. A simple regression analysis can show that the potential for excess returns becomes increasingly compromised, and can even turn negative, when valuations reach these levels.
Figure 6: Opportunities abound in certain sectors, while others look more expensive
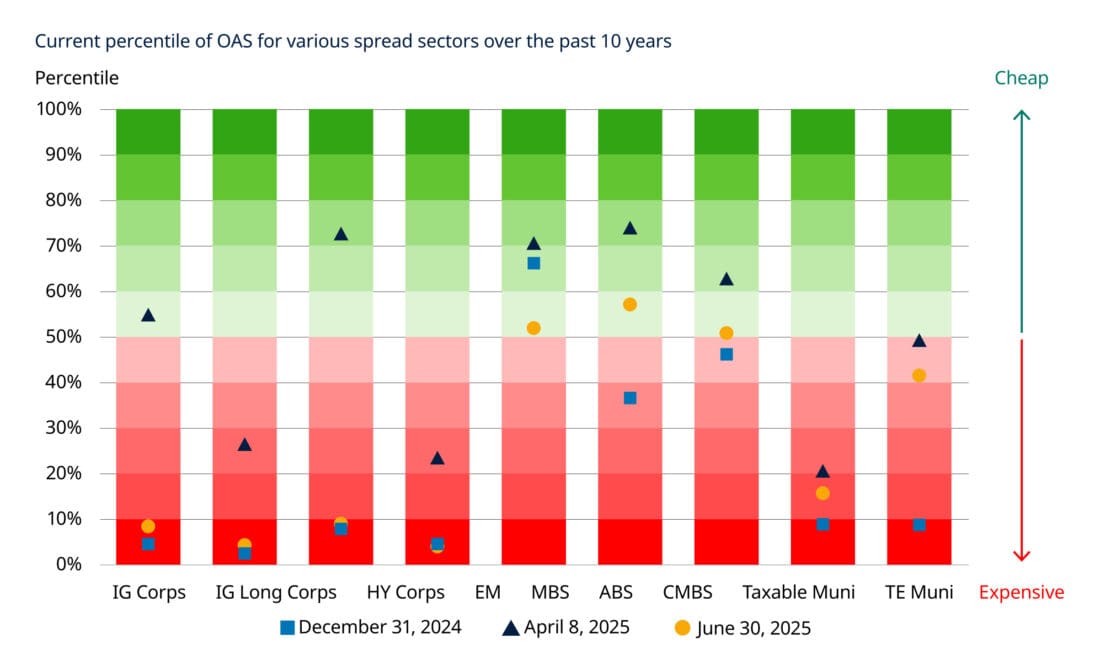
Source: Schroders, LSEG DataStream, Bloomberg, as of June 30, 2025. Indices used are the Bloomberg US Corporate Index, Bloomberg Corporate High Yield Index, Bloomberg Emerging Markets USD Aggregate Index, Bloomberg US Mortgage-Backed Securities Index, Bloomberg US Aggregate ABS Total Return Index, Bloomberg US Aggregate CMBS Index, ICE BofA US Municipal Index, and the ICE BofA Broad US Taxable Municipal Securities Index. Municipal data uses the AAA Municipal yield as a percentage of the 30-Year Treasury yield.
Past performance is not indicative of future results
While the credit sector has been resilient, expensive spreads have become harder to defend
We have advocated for allocations to corporate credit above what might have been suggested in recent quarters by a purely valuation-based glidepath (whereby adjustments to allocations are made only on the basis of valuation metrics like yield spreads). We believe this approach was justified in response to broadly stable fundamentals, a favorable macroeconomic backdrop and supportive global demand, driven by corporate credits offering attractive all-in yields. In our view, the volatility in spreads created by the Trump Administration’s announcement, in April, of higher tariffs created another opportunity to increase exposure to credit markets.
In recent weeks, however, this favorable view of corporate credits became increasingly harder to defend. Spreads have retraced and reached 20-year tights, even amid unfavorable conditions that include increasing policy uncertainty, softening economic momentum, and moderating demand, particularly from global investors. The current risk premium within credit spreads is approaching historical extremes. That means collecting interest payments (carry) is now the main source of returns, with little room for any price gains realized from further spread compression.
Investors can now receive comparable or higher yields in higher-rated, less cyclical alternatives such as securitized assets and municipal bonds. We believe both sectors provide a much more favorable risk/reward profile than corporate credit does now. Absent a major economic downturn, corporate valuations are likely to remain full, investor sentiment is complacent, and the opportunity cost that might be incurred from not owning corporates is as low as it has been in a decade. All that being said, it is important to note that pockets of value do exist within certain industries, such as energy, autos and banks.
Securitized markets offer structure, spreads and stability
In contrast to corporates, we have a favorable view of securitized assets, particularly agency mortgages. Their performance has been merely ordinary over the past several years, as elevated interest rate volatility and muted demand from bank buyers caused mortgages to struggle to keep up with other spread sectors. However, we expect these factors to become more favorable for the sector. First, a decline in interest rate volatility, particularly if the Fed cuts rates further, would be beneficial for returns on agency mortgages. Secondly, the demand/supply picture is likely to improve. Various changes in banking regulations, both global and domestic, are expected to free up capital for banks to buy more mortgages. On the supply side, the volume of new bonds should remain limited, given that housing transactions are now close to a 30-year low.
Finally, and perhaps most beneficially for the sector, valuations are quite attractive, relative to the sector’s history and to other sectors, particularly corporates. Investors no longer have to give up yield to own agency mortgage debt over corporates, and that is an extremely unusual situation. Although mortgages have pre-payment quirks, given that homeowners can prepay or refinance their debt, as a number do when rates decline, for investors, they offer minimal default risk. In our view, that means they offer a good risk/reward trade-off for longer-term investors.
Within the agency market, we think investors can find especially attractive opportunities with lower-coupon securities (those in the range of 2.5%-3.0%) and higher-coupon securities (5.0% -6.0%) that are backed by prepayment-protected collateral. One area we particularly like are floating-rate agency collateralized mortgage obligation (CMO) floaters. In our view, these are now offering an alluring combination of yield and spread, while having appealing convexity characteristics that enable them to behave more favorably than other types of fixed income securities when interest rates change.
Municipals are unloved and unwanted but may be the best opportunity available
The area of the fixed-income market that we think warrants the most excitement from investors now is municipal bonds, particularly at the long end of the yield curve. Taxable-equivalent yields are approaching 8% for high quality AA- and AAA-rated assets. At those yield levels, the sector stands out as an oasis in the desert of opportunity for spread assets.
The municipal market, particularly at longer maturities, has had a challenging 2025, with elevated issuance and an effective buyers’ strike against long-duration assets. This has led to a year-to-date return of -3.38% as of June 30. That represents more than 700 basis points of underperformance relative to long investment-grade corporates, which returned +3.64%.
This degree of underperformance is extremely unusual and is driven more by technical factors than fundamentals. That is the reason why we believe a significant opportunity exists today. Municipal-to-Treasury yield ratios are now approaching 100%. That means investors can get the tax benefits that municipals offer for free, as they do not have to sacrifice any yield to obtain tax-free income. Further, our proprietary tool for measuring valuation in the municipal market, the Net Implied Tax Rate , shows municipals are extremely cheap, relative to their history.
There have been a few catalysts for the underperformance, some of which have already ended. First, the US Congress’s budget reconciliation process weighed heavily on the municipal market. At various points, there were concerns that newly issued municipal bonds might no longer have tax-exempt status, but the final legislation, to the market’s relief, preserved that status. In fact, it even added a new sector that can now issue municipal bonds—spaceports. OBBBA defines a spaceport as a facility that is located near a launch or reentry site and is used for various activities related to space travel. These facilities can now be built and funded with financing from tax-exempt municipal bonds. More than a few members of our investment team are excited about the fact that our research, which has always included on-site visits to evaluate issuers, will now require trips to spaceports!
The uncertainty about the potential loss of the tax exemption did cause a surge in issuance, as issuers rushed to go to market before the change in the rule on newly issued bonds might go into effect. This year, new issuance is up 22% over the corresponding period for 2024. That spike in supply negatively impacted market performance in recent months.
The second adverse factor has been the fear among retail investors that higher tariffs will lead to runaway inflation. If there is one key driver of the municipal market’s relative valuation, it is retail investors’ fear that interest rates will move higher. Historically, such worries have always led retail investors to sell or avoid buying municipal bonds.
In other words, the recent underperformance of municipals has been a good, old-fashioned technical dislocation in the municipal bond market and not the result of any warranted concerns about the fundamental condition of municipal issuers. In fact, state governments are sitting with historically high reserve funds. As we have seen with previous cycles of municipal bond market cheapening, the initial selloffs can be quick and brutal, but the subsequent move back to normal valuations can take time.
Conclusion: The fundamentals underpinning bond markets remain favorable
Despite the relentless barrage of headlines over recent months, we believe investors should not lose sight of the favorable fundamentals underpinning fixed income markets. These include attractive valuations, macroeconomic tailwinds and historically underallocated investors. Consideration should also be given to the potential for favorable Treasury Department and central bank intervention or other positive fiscal developments that could benefit long-maturity bonds. In terms of sectors, we think investors will benefit from a more selective approach to sector allocation. While we think investors can continue to expect more alarming headlines and noise in the markets, our advice is: “Focus on the numbers in front of you.” Today’s high yields, and what the historical evidence suggests that means for future returns, indicate fixed income returns are likely to be far more favorable in the coming quarters.
—
Originally Posed July 30, 2025 – Fixed income markets proved resilient amid a first half of the year that brought multiple challenges
End notes
1. “Debt Service, Military Spending, and the Fiscal Limits of Power,” by Niall Ferguson, Milbank Family Senior Fellow; Chairman, Hoover Applied History Working Group; Hoover Institution, 2/1/25
2. Source: Much of the work of the economists Carmen Reinhart and Kenneth Rogoff was laid out in a seminal paper – “Growth in a Time of Debt,” published in January 2010 by the National Bureau of Economic Research – and the book, “This Time Is Different: Eight Centuries of Financial Folly,” originally published in 2009 by Princeton University Press.
The views and opinions contained herein are those of Schroders’ investment teams and/or Economics Group, and do not necessarily represent Schroder Investment Management North America Inc.’s house views. These views are subject to change. This information is intended to be for information purposes only and it is not intended as promotional material in any respect.
Disclosure: Schroders
Important Information: This communication is marketing material. The views and opinions contained herein are those of the author(s) on this page, and may not necessarily represent views expressed or reflected in other Schroders communications, strategies or funds. This material is intended to be for information purposes only and is not intended as promotional material in any respect. The material is not intended as an offer or solicitation for the purchase or sale of any financial instrument. It is not intended to provide and should not be relied on for accounting, legal or tax advice, or investment recommendations. Reliance should not be placed on the views and information in this document when taking individual investment and/or strategic decisions. Past performance is not a reliable indicator of future results. The value of an investment can go down as well as up and is not guaranteed. All investments involve risks including the risk of possible loss of principal. Information herein is believed to be reliable but Schroders does not warrant its completeness or accuracy. Some information quoted was obtained from external sources we consider to be reliable. No responsibility can be accepted for errors of fact obtained from third parties, and this data may change with market conditions. This does not exclude any duty or liability that Schroders has to its customers under any regulatory system. Regions/ sectors shown for illustrative purposes only and should not be viewed as a recommendation to buy/sell. The opinions in this material include some forecasted views. We believe we are basing our expectations and beliefs on reasonable assumptions within the bounds of what we currently know. However, there is no guarantee than any forecasts or opinions will be realized. These views and opinions may change. Schroder Investment Management North America Inc. is a SEC registered adviser and indirect wholly owned subsidiary of Schroders plc providing asset management products and services to clients in the US and Canada. Interactive Brokers and Schroders are not affiliated entities. Further information about Schroders can be found at www.schroders.com/us. Schroder Investment Management North America Inc. 7 Bryant Park, New York, NY, 10018-3706, (212) 641-3800.
Disclosure: Interactive Brokers Third Party
Information posted on IBKR Campus that is provided by third-parties does NOT constitute a recommendation that you should contract for the services of that third party. Third-party participants who contribute to IBKR Campus are independent of Interactive Brokers and Interactive Brokers does not make any representations or warranties concerning the services offered, their past or future performance, or the accuracy of the information provided by the third party. Past performance is no guarantee of future results.
This material is from Schroders and is being posted with its permission. The views expressed in this material are solely those of the author and/or Schroders and Interactive Brokers is not endorsing or recommending any investment or trading discussed in the material. This material is not and should not be construed as an offer to buy or sell any security. It should not be construed as research or investment advice or a recommendation to buy, sell or hold any security or commodity. This material does not and is not intended to take into account the particular financial conditions, investment objectives or requirements of individual customers. Before acting on this material, you should consider whether it is suitable for your particular circumstances and, as necessary, seek professional advice.
Disclosure: Bonds
As with all investments, your capital is at risk.









Join The Conversation
If you have a general question, it may already be covered in our FAQs page. go to: IBKR Ireland FAQs or IBKR U.K. FAQs. If you have an account-specific question or concern, please reach out to Client Services: IBKR Ireland or IBKR U.K..
Visit IBKR U.K. Open an IBKR U.K. Account