


 Client Portal – Trading and Advanced Functions (Cantonese)")


At a Glance
As geopolitical tensions, shifts in trade policies and inflationary pressures remain elevated, investors may turn to less-correlated markets
Alternative asset classes like commodities and cryptocurrencies could play a bigger role in investors’ portfolios
In 2025, portfolio diversification is becoming a key strategy for managing risk. As investors look to derisk the weight of U.S. equities, four key areas of interest have emerged.
1. Diversification Within U.S. Equities
U.S. equities set record highs last year, and the weight of U.S. equities as a percentage of global equity comprised nearly 67% by the end of 2024, up from 62.57% in 2023, according to the MSCI All Country World Index (ACWI). Within U.S. equities, the combined weight of Apple, Nvidia, Microsoft, Amazon and Alphabet in the S&P 500 reached nearly 29% on December 31, 2024.
The dominance of U.S. equities combined with the heavy concentration in the top five names is a reminder for investors to proactively manage concentration risk and diversify within the equity asset class itself.
During market selloffs led by mega-cap names, the S&P 500 Equal Weight Index tends to decline less than the cap-weighted S&P 500. As an example of its ability to reduce risk, on January 27, 2025 the S&P 500 declined -1.46% on a price return basis, led by Nvidia, when investors learned of the Chinese AI company, DeepSeek. The S&P 500 Equal Weight Index posted +0.02% on the same day.
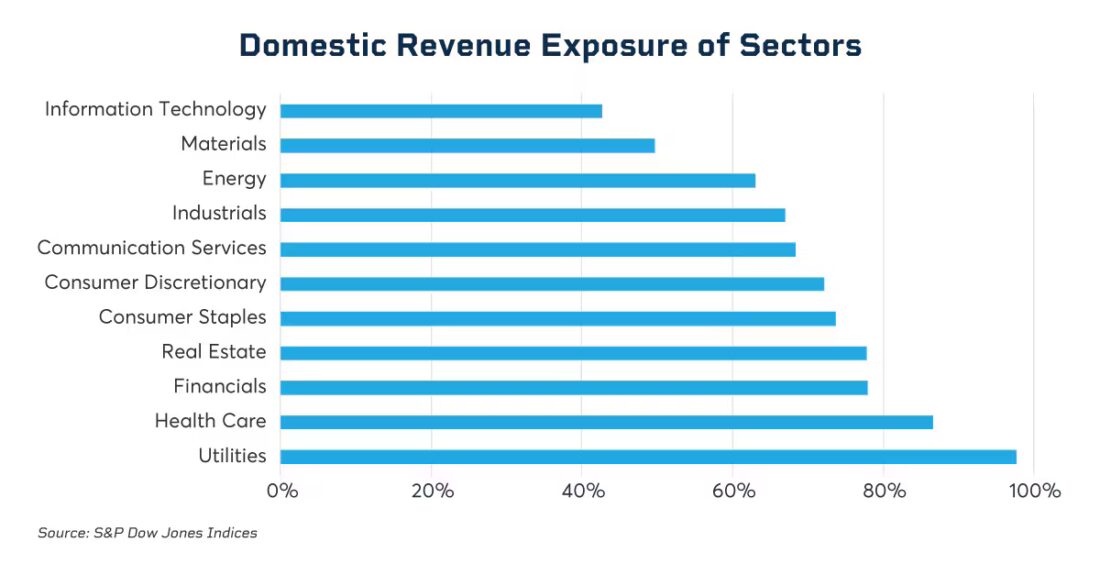
Performance can also vary by sector. One way to assess the potential implications of trade policy changes, for example, would be to determine the percentage of foreign and domestic revenue received by companies in each Global Industry Classification Standard (GICS) sector. An S&P Global study shows that sectors such as financials, utilities, health care and real estate have the highest percentage of domestic revenue while sectors such as industrials, energy, materials and information technology have a higher percentage of foreign revenue.
Sector performance since the presidential election has been mixed, with a wide dispersion of returns observed among the sectors. Industrials, consumer discretionary and financials posted double-digit gains while materials, health care and real estate are in the negative. The wide dispersion of returns may continue for the remainder of 2025 as the market digests evolving trade policies and their potential impact.
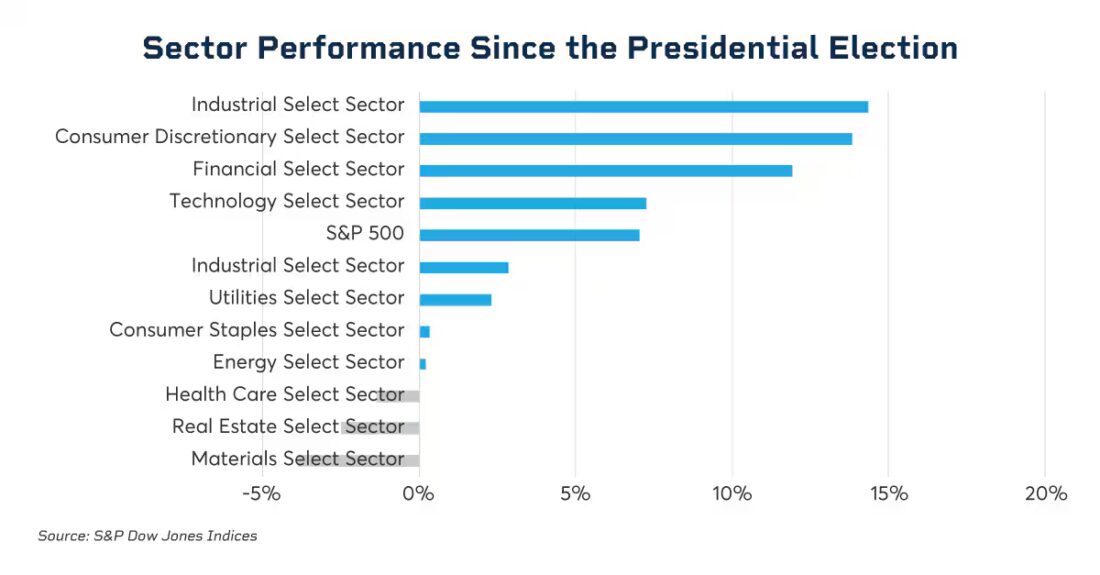
As trade-related events continue to unfold, Sector futures and options can be important tools within the U.S. equity space to make tactical adjustments as well as medium term repositioning.
2. Diversification with Less-Correlated Markets
Investors are increasingly looking to international equity markets to diversify their U.S. equity holdings. Japanese equities, in particular, are gaining more attention. The Nikkei 225 Index, measured in local currency yen, posted significant gains in 2023 (28.24%) and 2024 (19.22%) due to an economic rebound and the return of inflation. Additionally, the correlation between U.S. and Japanese equities has been decreasing in recent months.
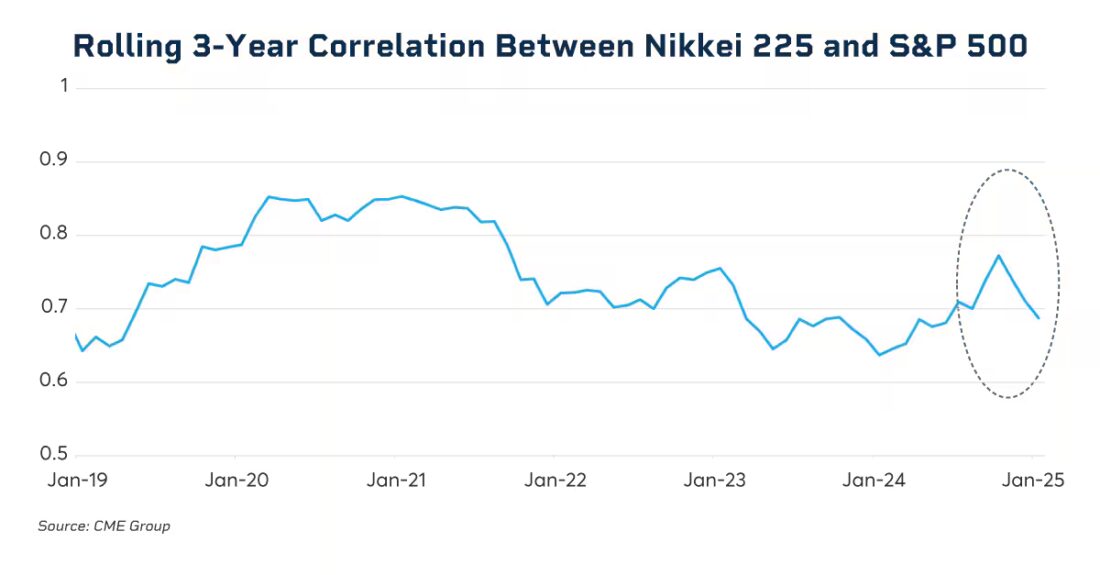
Past performance is not indicative of future results.
3. Broad Exposure via Commodity Indices
2024 was one of the turning points for commodities, as both the S&P GSCI and Bloomberg Commodity Index (BCOM) posted positive returns. Commodity markets could continue to be active throughout 2025 as the implications of geopolitical tensions, shifts in trade policies and inflationary pressures remain elevated.
| Commodity Indices – 2024 Returns | Spot Return | Total Return | Excess Return |
| S&P GSCI | 2.61% | 9.25% | 3.79% |
| Bloomberg Commodity Index (BCOM) | 6.27% | 5.38% | 0.12% |
Source: Bloomberg, S&P Dow Jones Indices. Data as of 12/31/2024. Returns in USD.
When it comes to commodities though, index choice matters. For example the S&P GSCI is production weighted and does not apply sector weight constraints. As a result, the index tilts heavily toward energy. The BCOM index, however, is a combination of production and liquidity weighting while maintaining equal weight across sectors. As a result, the two indices can have different risk/return profiles depending on which commodity sectors are driving the performance.
Adoption of the CME Group commodity complex, which includes S&P GSCI and BCOM futures, has increased significantly since 2020, with open interest (OI) growing from nearly $900M to almost $6B in notional basis as of January 31, 2025.
Uncertainty Continues
Market uncertainty has heightened in 2025 amid shifts in trade policy, inflation remaining stubbornly elevated and investors becoming cautious of the outsized returns generated by mega-cap stocks. Amid these changes, diversification as a risk management tool is becoming central to investing for many market participants.
—
Originally Posted on April 28, 2025 – Will 2025 Be the Year of Diversification in Equities?
Disclosure: CME Group
© [2023] CME Group Inc. All rights reserved. This information is reproduced by permission of CME Group Inc. and its affiliates under license. CME Group Inc. and its affiliates accept no liability or responsibility for the information contained herein, including but not limited to the currency, accuracy and/or completeness of this information, and delays, interruptions, errors or omissions. This information is an unofficial copy and may not reflect the official and accurate version. For the definitive and up-to-date version of any of this information, please see cmegroup.com.
Disclosure: Interactive Brokers Third Party
Information posted on IBKR Campus that is provided by third-parties does NOT constitute a recommendation that you should contract for the services of that third party. Third-party participants who contribute to IBKR Campus are independent of Interactive Brokers and Interactive Brokers does not make any representations or warranties concerning the services offered, their past or future performance, or the accuracy of the information provided by the third party. Past performance is no guarantee of future results.
This material is from CME Group and is being posted with its permission. The views expressed in this material are solely those of the author and/or CME Group and Interactive Brokers is not endorsing or recommending any investment or trading discussed in the material. This material is not and should not be construed as an offer to buy or sell any security. It should not be construed as research or investment advice or a recommendation to buy, sell or hold any security or commodity. This material does not and is not intended to take into account the particular financial conditions, investment objectives or requirements of individual customers. Before acting on this material, you should consider whether it is suitable for your particular circumstances and, as necessary, seek professional advice.
Disclosure: Futures Trading
Futures are not suitable for all investors. The amount you may lose may be greater than your initial investment. Before trading futures, please read the CFTC Risk Disclosure. A copy and additional information are available at the Warnings and Disclosures section of your local Interactive Brokers website.
Disclosure: Options Trading
Options involve risk and are not suitable for all investors. For information on the uses and risks of options read the "Characteristics and Risks of Standardized Options" also known as the options disclosure document (ODD). Multiple leg strategies, including spreads, will incur multiple transaction costs.
Disclosure: ETFs
Any discussion or mention of an ETF is not to be construed as recommendation, promotion or solicitation. All investors should review and consider associated investment risks, charges and expenses of the investment company or fund prior to investing. Before acting on this material, you should consider whether it is suitable for your particular circumstances and, as necessary, seek professional advice.


Join The Conversation
If you have a general question, it may already be covered in our FAQs page. go to: IBKR Ireland FAQs or IBKR U.K. FAQs. If you have an account-specific question or concern, please reach out to Client Services: IBKR Ireland or IBKR U.K..
Visit IBKR U.K. Open an IBKR U.K. Account