


 Client Portal – Trading and Advanced Functions (Cantonese)")


1/ A Look at Market Breadth
Investopedia is partnering with CMT Association on this newsletter. The contents of this newsletter are for informational and educational purposes only, however, and do not constitute investing advice. The guest authors, which may sell research to investors, and may trade or hold positions in securities mentioned herein do not represent the views of CMT Association or Investopedia. Please consult a financial advisor for investment recommendations and services.
1/
A Look at Market Breadth
It is always important to dig into the details when we are looking at markets. One of the best ways to do that is with market breadth.
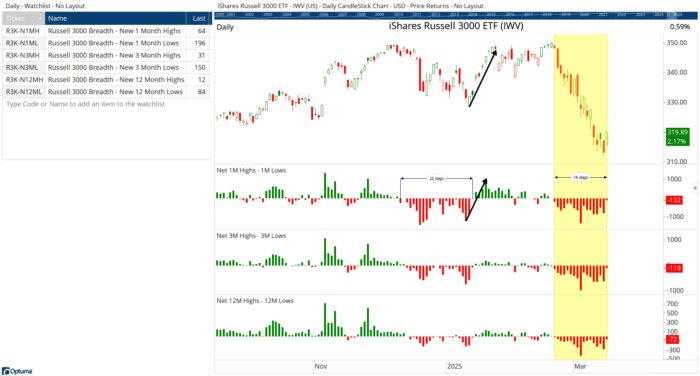
Not surprisingly, market breadth has been very weak over the last few weeks. Here’s a chart of the Russell 3000 with the new high / low membership counts over 3 lookback timeframes (1 month, 3-month, and 12 months). The yellow shaded area shows that since the February highs the daily number of members making new highs have been overtaken by those making new lows, resulting in the negative histogram over the last 16 days, with Friday March 14th having 64 new 1-month highs, versus 196 new lows, for a net value of -132:

Past performance is not indicative of future results
The index will struggle to make gains if these market internals don’t show signs of improvement, starting with more 1-month highs – which is what happened in January as marked by the black arrows.
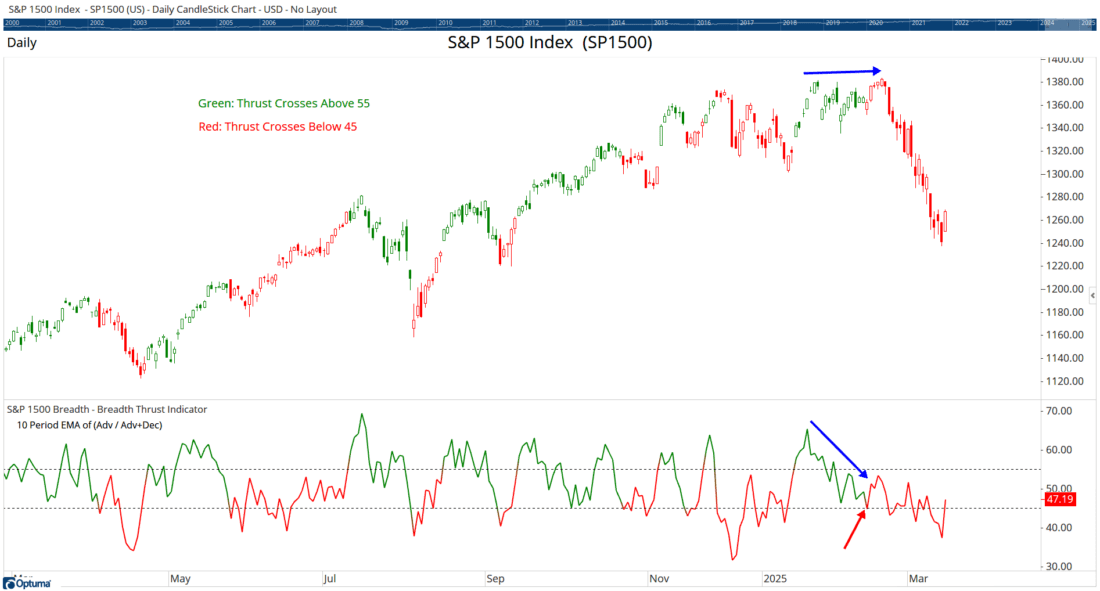
Another measure is the Breadth Thrust indicator which takes the 10-day exponential moving average of the daily number of advancers divided by the sum of advancers minus declines. The chart is coloured green when the Breadth Thrust value is above 55, turning to red below 45 – which happened on February 12th for the S&P1500 stocks as it just crossed the threshold, and creating a divergence with the price chart. We’ll see if these breadth measures improve over the coming days.
Past performance is not indicative of future results
—
Originally posted 18th March 2025
Disclosure: Investopedia
Investopedia.com: The comments, opinions and analyses expressed herein are for informational purposes only and should not be considered individual investment advice or recommendations to invest in any security or to adopt any investment strategy. While we believe the information provided herein is reliable, we do not warrant its accuracy or completeness. The views and strategies described on our content may not be suitable for all investors. Because market and economic conditions are subject to rapid change, all comments, opinions and analyses contained within our content are rendered as of the date of the posting and may change without notice. The material is not intended as a complete analysis of every material fact regarding any country, region, market, industry, investment or strategy. This information is intended for US residents only.
Disclosure: Interactive Brokers Third Party
Information posted on IBKR Campus that is provided by third-parties does NOT constitute a recommendation that you should contract for the services of that third party. Third-party participants who contribute to IBKR Campus are independent of Interactive Brokers and Interactive Brokers does not make any representations or warranties concerning the services offered, their past or future performance, or the accuracy of the information provided by the third party. Past performance is no guarantee of future results.
This material is from Investopedia and is being posted with its permission. The views expressed in this material are solely those of the author and/or Investopedia and Interactive Brokers is not endorsing or recommending any investment or trading discussed in the material. This material is not and should not be construed as an offer to buy or sell any security. It should not be construed as research or investment advice or a recommendation to buy, sell or hold any security or commodity. This material does not and is not intended to take into account the particular financial conditions, investment objectives or requirements of individual customers. Before acting on this material, you should consider whether it is suitable for your particular circumstances and, as necessary, seek professional advice.
Disclosure: ETFs
Any discussion or mention of an ETF is not to be construed as recommendation, promotion or solicitation. All investors should review and consider associated investment risks, charges and expenses of the investment company or fund prior to investing. Before acting on this material, you should consider whether it is suitable for your particular circumstances and, as necessary, seek professional advice.
Disclosure: Futures Trading
Futures are not suitable for all investors. The amount you may lose may be greater than your initial investment. Before trading futures, please read the CFTC Risk Disclosure. A copy and additional information are available at the Warnings and Disclosures section of your local Interactive Brokers website.


Join The Conversation
If you have a general question, it may already be covered in our FAQs page. go to: IBKR Ireland FAQs or IBKR U.K. FAQs. If you have an account-specific question or concern, please reach out to Client Services: IBKR Ireland or IBKR U.K..
Visit IBKR U.K. Open an IBKR U.K. Account