


Stocks leaped to fresh records after a much weaker-than-expected jobs report inspired rate cut optimism, but it wasn’t long before the enthusiasm faded and was replaced with slowdown angst. Indeed, sluggish hiring amidst rising unemployment opened the door to a 50 basis-point reduction from the Fed this month with odds standing at 13%; however, Wall Street is worried that the central bank is late in its ability to prevent contracting payrolls on a morning in which June’s headcount additions were revised to -13,000. Furthermore, the capital-intensive real estate and manufacturing sectors continue to serve as drags on the economy. These categories would especially benefit from monetary policy accommodation and turn them into tailwinds rather than headwinds. Equities are being pounded with all major domestic benchmarks suffering losses alongside the greenback, which is retreating due to cheaper stateside borrowing costs. Energy commodities are also descending although gold, copper, silver and lumber are posting gains. Investors are rushing to the Treasury complex as the yield curve plunges in bull-steepening fashion led by the short-end while fixed-income watchers pencil in around three quarter point trims from the Fed this year.
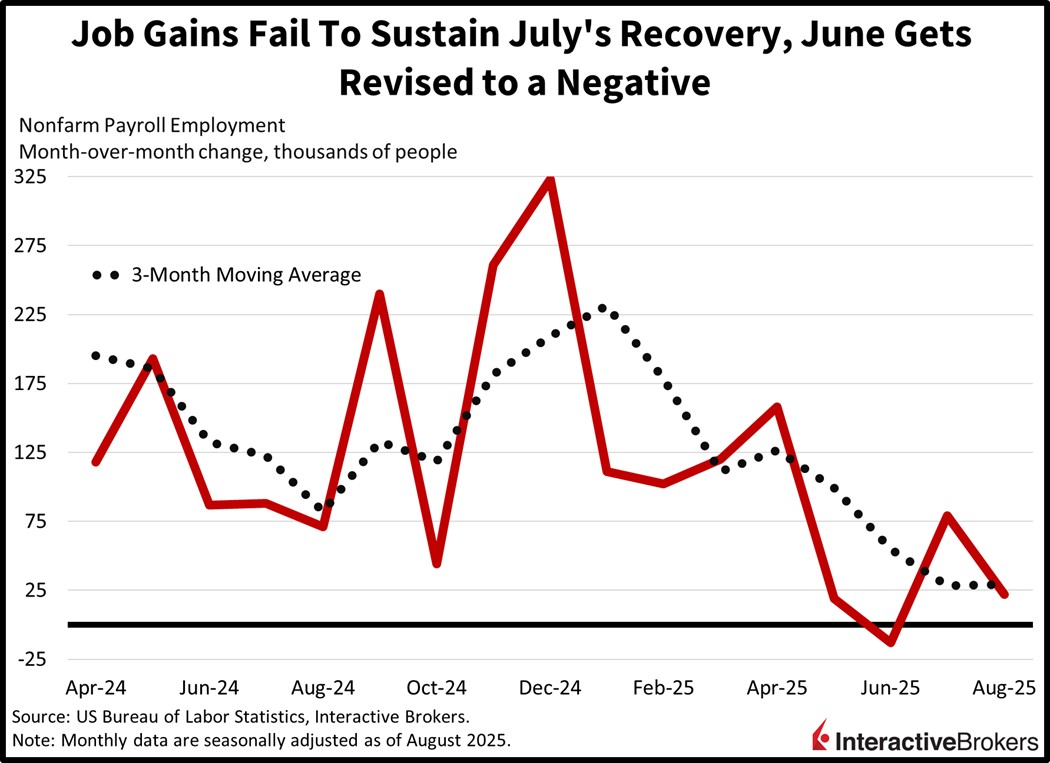
Hiring Disappoints
The US economy failed to maintain its hiring recovery experienced in July, with last month’s figures decelerating sharply. August job growth of just 22,000 was well below the median estimate of 75,000 and the prior period’s 79,000. There were some bright spots in a few of the cyclical areas of the labor market, such as leisure/hospitality, other services and retail, which added 28,000, 12,000 and 11,000 positions. The non-cyclical private education/health care category, however, led the pack, expanding by 46,000. The only other net addition came from transportation/warehousing, which boosted payrolls by 4,000. The remaining nine major segments all had reduced headcounts with professional/business services, government, wholesale trade, manufacturing losing 17,000, 16,000, 12,000 and 12,000. Construction, mining, utilities, information, financial activities rosters descended by less than 10,000.
Past performance is not indicative of future results.
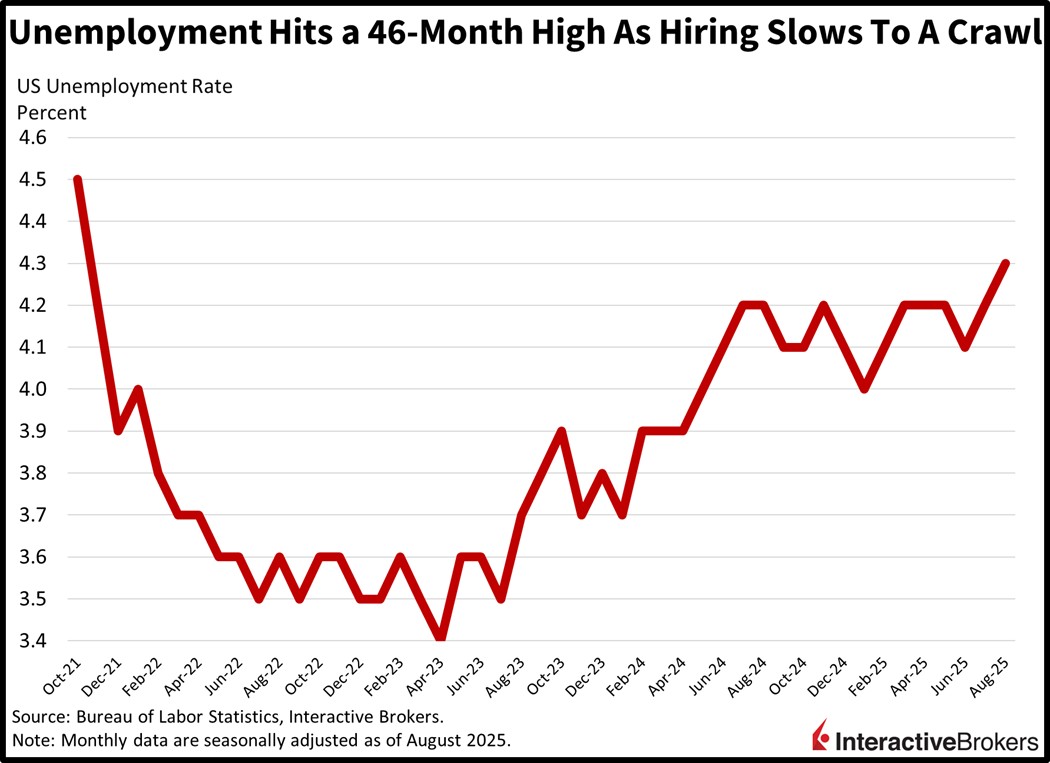
Unemployment Hits 46-Month High
The slow pace of hiring drove the unemployment rate to a 46-month high of 4.3% amidst a climb in the labor force and its associated participation level. Indeed, after three consecutive months of declines, the number of people either working or looking for jobs expanded by 436,000. That jump combined with a month-over-month (m/m) rise of 148,000 jobless folks caused the percentage of idle individuals to hit 4.3%. On the bright side, wages continued to grow much faster than inflation, with average hourly earnings increasing 0.3% m/m and 3.7% year over year (y/y). Hours in a work week remained steady at a 34.2 mean.
Past performance is not indicative of future results.
50 From the Fed in Déjà vu Fashion
Decelerating hiring in the summer of 2024 was cured by a few rate cuts by the end of that year and I think we’re facing a Deja vu moment in 2025. Additionally, employment growth is poised to ascend as it reaps the benefits of stimulus from both the fiscal and monetary authorities as we approach the final months of the calendar. It is a weak seasonal period and the current set up leaves equities vulnerable to further downside, but those are buyable dips if you agree with me that the cycle is on solid footing. Despite today’s set back, the reacceleration path remains intact, driven by rebounding consumers, confident businesses, buoyant capital markets, a looser central bank, pro-business legislation and a slowing, but still healthy labor market.
International Roundup
Unemployment Climbs in Canada
Canada’s labor market continued to contract with payrolls declining and unemployment climbing higher than expected last month, according to Statistics Canada. The number of employed individuals fell by 66,000 after a 41,000 July drop. The economist consensus estimate called for an increase of 4,900. The loss included 60,000 part-time workers.
The number of full-time workers, however, was roughly unchanged following a 51,000 decline in July. Industries with shrinking payrolls and the extent of the changes were as follows:
- Professional, scientific and technical services, 26,000
- Transportation and warehousing, 23,000
- Manufacturing, 19,000
Conversely, construction employment increased by 17,000.
Also in August, the unemployment rate climbed from 6.9% to 7.1%, surpassing the economist estimate of 7%. Statistics Canada also reported that out-of-work individuals are continuing to struggle with finding jobs. Indeed, only 15.2% of unemployed individuals in July were punching time clocks last month. Despite the labor market weakness, wages in August were up 3.1% y/y after climbing 3.3% y/y in July.
Canada PMI is Almost Neutral
Canada’s economy barely expanded in August with the Purchasing Manager’s Index from the Ivey Business School falling from 55.8 in July to 50.1, the lowest level in three months. A score of 50 is the contraction-expansion threshold. Within the index, the employment gauge fell from 51.2 to 46 while the deliveries component dropped from 50.2 to 47. The price component also weakened, sinking from 68.5 to 65.1. Inventories bucked the trend, moving from 48.7 in July to 49.5 last month.
Singapore Retail Sales Pick Up
Consumer spending in Singapore grew 4.1% m/m and 4.8% y/y in July, a significant improvement from the 2.4% and -1.1% June prints.
The supermarkets and hypermarkets category, the other classification and the mini-marts and convenience stores group led the m/m gain with sales jumping 9.6%, 8.2% and 6.1%. Also demonstrating strength were motor vehicles, up 5.5%, and computer and telecommunications equipment, up 5.7%. Categories with declines and the amount of the changes were as follows:
- Furniture and housewares, 1.8%
- Cosmetics, toiletries and medical goods, 1%
- Wearing apparel and footwear, 0.5%
UK Posts Second Month of Retail Sales Growth
UK shoppers increased the volume of their purchases by 0.6% in July m/m, an acceleration from the 0.3% expansion in June and stronger than the economist consensus estimate for an unchanged result. Sales volumes were also up 1.1% y/y, which missed the forecast for a 1.3% jump but was stronger than June’s 0.9% print.
Sales in the non-store retailing group and the textile clothing and footwear category both climbed 2.5% while automotive fuel and household goods moved north by 0.9% and 0.5%. Detracting from the headline gain were department stores and food stores with declines of 1.5% and 0.2%.
But Home Price Appreciation Slows
UK home prices climbed 0.3% m/m in August, according to the Halifax House Price Index. The result exceeded the economist consensus estimate of 0.2% but slowed from July’s 0.4% gain. Relative to August 2024, homes costs 2.2% more compared to the 2% increase anticipated by economists and July’s 2.5% advance.
After a Monthly Decline, Retailing Turns Positive in Japan
Retail spending grew 1.7% m/m in July, a reversal from the 5.2% drop in June and stronger than the economist consensus estimate of 1.3%. The y/y metric also strengthened, moving from 1.3% in June to 1.4% in July, but it fell below the 2.2% estimate.
While Leading Indicator Climbs Modestly
Japan’s Leading Index is up 0.8% m/m for July, matching its rate of increase from June. The index score of 105.9, furthermore, marginally beat the economist consensus forecast of 105.8.
New to Interactive Brokers?
Open AccountDisclosure: Interactive Brokers Affiliate
Information posted on IBKR Campus that is provided by third-parties does NOT constitute a recommendation that you should contract for the services of that third party. Third-party participants who contribute to IBKR Campus are independent of Interactive Brokers and Interactive Brokers does not make any representations or warranties concerning the services offered, their past or future performance, or the accuracy of the information provided by the third party. Past performance is no guarantee of future results.
This material is from IBKR Macroeconomics, an affiliate of Interactive Brokers LLC, and is being posted with its permission. The views expressed in this material are solely those of the author and/or IBKR Macroeconomics and Interactive Brokers is not endorsing or recommending any investment or trading discussed in the material. This material is not and should not be construed as an offer to buy or sell any security. It should not be construed as research or investment advice or a recommendation to buy, sell or hold any security or commodity. This material does not and is not intended to take into account the particular financial conditions, investment objectives or requirements of individual customers. Before acting on this material, you should consider whether it is suitable for your particular circumstances and, as necessary, seek professional advice.


Join The Conversation
If you have a general question, it may already be covered in our FAQs page. go to: IBKR Ireland FAQs or IBKR U.K. FAQs. If you have an account-specific question or concern, please reach out to Client Services: IBKR Ireland or IBKR U.K..
Visit IBKR U.K. Open an IBKR U.K. Account