


By Alex Cole
1/ S&P SPDR: State of the Trend
2/ Momentum Analysis
3/ Data Visualization
4/ Volatility and Volume
Investopedia is partnering with CMT Association on this newsletter. The contents of this newsletter are for informational and educational purposes only, however, and do not constitute investing advice. The guest authors, which may sell research to investors, and may trade or hold positions in securities mentioned herein do not represent the views of CMT Association or Investopedia. Please consult a financial advisor for investment recommendations and services.
1/
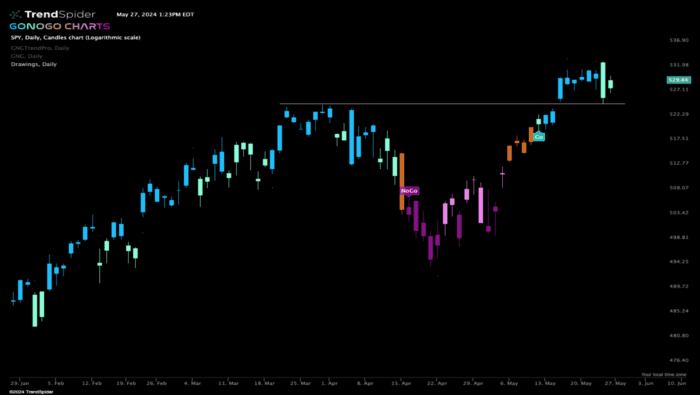
S&P SPDR: State of the Trend
There has been a lot of excitement over the past few weeks as the S&P 500 (as well as other major indices) has hit new all time highs. Using a GoNoGo Chart, we create a trend model by blending some of the foundational concepts of trend following technical analysis, and then color coding the price candle (or bar, etc) according to the strength of its trend. We can see that with the close of trading on May 10th, GoNoGo Trend flagged a new “Go”, having risen out of a period of uncertainty (reflected by amber “Go Fish” bars). A few days later, as the trend strengthened from aqua to blue “Go” bars, price gapped to new highs above horizontal resistance.

Courtesy of TrendSpider – Past performance is not indicative of future results
Most recently, we see that price has fallen from its high, and GoNoGo Trend has weakened to paint aqua “Go” bars. Polarity tells us that what was once resistance can become support so we will watch to see if price can continue to find support at the horizontal level drawn on the chart.
2/
Momentum Analysis
A technical analyst is sure to turn to the study of momentum after having attempted to understand the current trend. Momentum can explain much about the strength of current price movements. GoNoGo Oscillator takes the same approach to momentum as GoNoGo’s original indicator takes to trend. It blends some of the most robust oscillators into one indicator that highlights the insights momentum analysis provides but does not clutter the chart with multiple panels.

Courtesy of TrendSpider – Past performance is not indicative of future results
Looking at the GoNoGo Oscillator we can see that momentum broke into positive territory ahead of the new “Go” flag. This is important, because we know that momentum is a leading indicator and can help prepare the investor for important price movements. We also know that the GoNoGo Oscillator was calculated in such a way that the zero line becomes an objective level. On the break above zero, combined with the first amber “Go Fish” bar, we knew that the “NoGo” trend was likely over. Most recently, GoNoGo Oscillator has peaked twice in overbought territory (at or above 5) and falling below that level told us that price may struggle to go higher in the short term. This is in line with the weakness we see from GoNoGo Trend painting aqua bars. We can now turn our eye to the zero line. If the “Go” trend is to remain healthy, we will look for GoNoGo Oscillator to remain at or above zero.
3/
Data Visualization
Technical analysts are the data visualization experts of the financial world. Using price charts we can literally see the trends that would be so hard to pick out of a table of data. However, we can go further, and highlight the important interaction between trend and momentum on the price chart itself using GoNoGo Icons. This brings our attention back to the price panel, and the important dynamics of supply and demand that can be seen at critical levels. There are two different types of icons that a GoNoGo Chart displays. The first is the Trend Continuation Icon. This icon is always a circle and can be seen in either “Go” trends or “NoGo” trends. We know the importance of the zero line when interpreting the GoNoGo Oscillator and the trend continuation icon appears when the oscillator finds support at that level in an up trend, or resistance at that level in a down trend. In a “Go” trend, the circle is green, and tells the user that momentum is resurgent in the direction of the underlying “Go” trend. We can see examples of these Go Trend Continuation Icons throughout the prior “Go” period.

Courtesy of TrendSpider – Past performance is not indicative of future results
The second icon that we see on a GoNoGo Chart is the Countertrend Correction Icon. These are red in a “Go” trend, and tell the user that momentum has declined from overbought levels. There is likely to be a cooling off period and in the short term price may struggle to go higher. We saw two of these Go Countertrend Correction Icons (red arrows) as investors digested the gains at new all time highs.
4/
Volatility and Volume
With the trend showing weakness on the recent pullback and GoNoGo Oscillator falling out of overbought territory, it would be wise to turn our attention to the zero line once again. As the oscillator approaches that level we must remember that in a healthy “Go” trend it should find support. In the recent “NoGo” correction, the zero line was tested from below and we see that it remained at that level for some time. That caused the climbing grid of GoNoGo Squeeze to reach its max. This visually reflects a period of reduced volatility as there is no directional momentum. Breakouts from Max GoNoGo Squeeze’s can often lead to significant price movement.

Courtesy of TrendSpider – Past performance is not indicative of future results
We will watch to see if the zero line provides support, either quickly or in the form of another GoNoGo Squeeze. If GoNoGo Oscillator bounces back into positive territory, we will be able to say that momentum is resurgent in the direction of the “Go” trend and the chart will display a fresh Go Trend Continuation Icon (green circle). If this happens, we will expect price to make an attack on prior highs.
—
Originally posted 28th May 2024
Disclosure: Investopedia
Investopedia.com: The comments, opinions and analyses expressed herein are for informational purposes only and should not be considered individual investment advice or recommendations to invest in any security or to adopt any investment strategy. While we believe the information provided herein is reliable, we do not warrant its accuracy or completeness. The views and strategies described on our content may not be suitable for all investors. Because market and economic conditions are subject to rapid change, all comments, opinions and analyses contained within our content are rendered as of the date of the posting and may change without notice. The material is not intended as a complete analysis of every material fact regarding any country, region, market, industry, investment or strategy. This information is intended for US residents only.
Disclosure: Interactive Brokers Third Party
Information posted on IBKR Campus that is provided by third-parties does NOT constitute a recommendation that you should contract for the services of that third party. Third-party participants who contribute to IBKR Campus are independent of Interactive Brokers and Interactive Brokers does not make any representations or warranties concerning the services offered, their past or future performance, or the accuracy of the information provided by the third party. Past performance is no guarantee of future results.
This material is from Investopedia and is being posted with its permission. The views expressed in this material are solely those of the author and/or Investopedia and Interactive Brokers is not endorsing or recommending any investment or trading discussed in the material. This material is not and should not be construed as an offer to buy or sell any security. It should not be construed as research or investment advice or a recommendation to buy, sell or hold any security or commodity. This material does not and is not intended to take into account the particular financial conditions, investment objectives or requirements of individual customers. Before acting on this material, you should consider whether it is suitable for your particular circumstances and, as necessary, seek professional advice.


Join The Conversation
If you have a general question, it may already be covered in our FAQs page. go to: IBKR Ireland FAQs or IBKR U.K. FAQs. If you have an account-specific question or concern, please reach out to Client Services: IBKR Ireland or IBKR U.K..
Visit IBKR U.K. Open an IBKR U.K. Account