1/ How Much Volatility is Too Much Volatility?
2/ Key Support Levels for QQQ as Tech Breaks Down
3/ Countertrend Rally in Play for Energy Stocks?
Investopedia is partnering with CMT Association on this newsletter. The contents of this newsletter are for informational and educational purposes only, however, and do not constitute investing advice. The guest authors, which may sell research to investors, and may trade or hold positions in securities mentioned herein do not represent the views of CMT Association or Investopedia. Please consult a financial advisor for investment recommendations and services.
1/
How Much Volatility is Too Much Volatility?
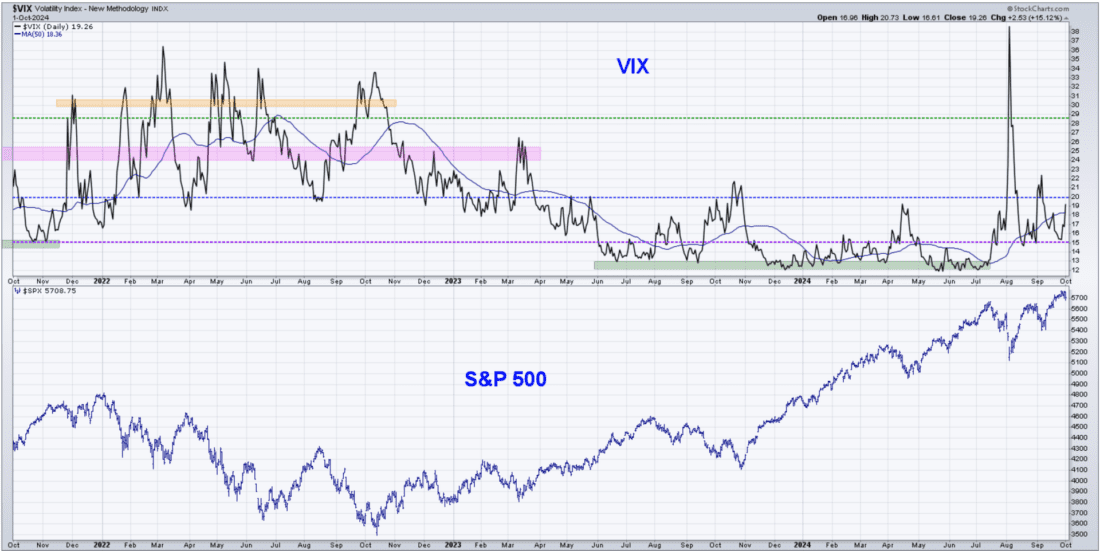
The VIX uses trading activity in the S&P 500 index options market to imply volatility for the S&P 500 index itself. Up until mid-July, the VIX has remained firmly in a “low volatility” range below 20. In fact, much of the first half of 2024 saw the VIX remain below 15.
A spike in the VIX, as we saw in early August when the VIX reached one of its highest levels in history, suggests elevated uncertainty and therefore elevate risks. For me, 20 is the key level to watch. Anything below 20 is probably noise, but anything above 20 means I sit up in my chair and take note.

Courtesy of StockCharts.com
Past performance is not indicative of future results
Since popping above 60 on an intraday basis in early August, the VIX has settled back between 15 and 20 for most of the last six weeks. But as we head into October, usually one of the weakest months based on seasonal trends, I’m watching for the telltale sign of a VIX spike above the 20 threshold.
The last two times we spiked above 20, in early August and early September, the S&P 500 experienced a brief pullback before retesting all-time highs. But all major market corrections in modern history have been marked by a spike in volatility. My mentor Ralph Acampora loves to refer to a famous market maxim, saying, “Markets go up the escalator and down the elevator.” A VIX over 20 means the elevator is most likely going down!
2/
Key Support Levels for QQQ as Tech Breaks Down
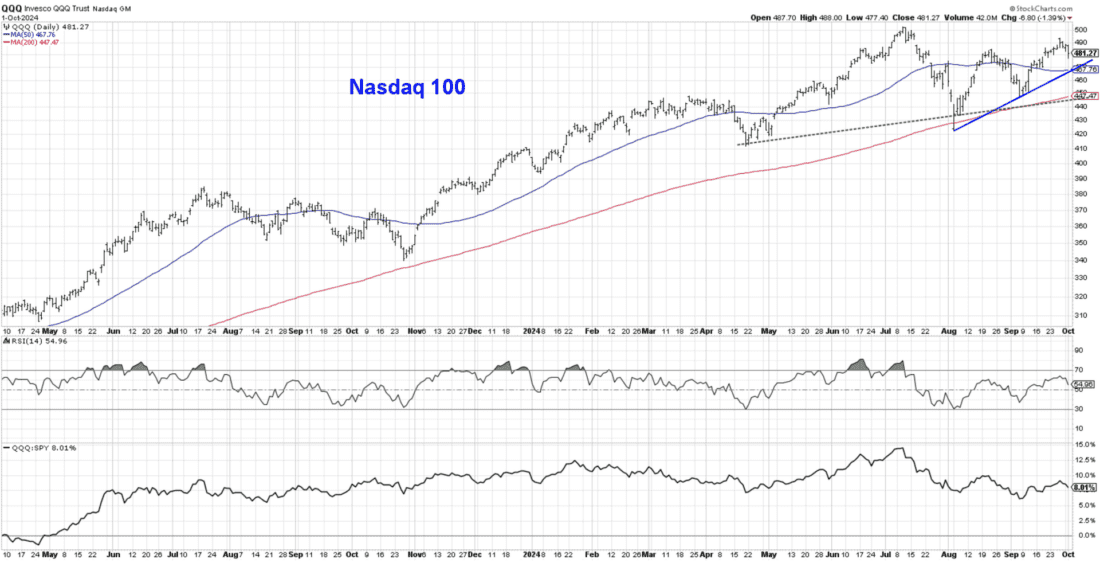
The first trading day of Q4 saw the technology sector drop over 2%, causing the tech-heavy Nasdaq 100 to underperform both the S&P 500 and Dow Jones Industrial Average. But how much downside would we need to see to label the QQQ as something other than a bullish trend?
As a trend-follower, my goal is to define trends and also to identify what signals would cause me to confirm a change in that trend. For the Nasdaq 100, a simple trendline off the recent swing lows could provide an easy way to identify a downside reversal

Courtesy of StockCharts.com
Past performance is not indicative of future results
Using the August and September lows as a starting point, we can draw a trendline which lines up quite well with the 50-day moving average. So as long as the QQQ remains above trendline support, then any sort of pullback is just “noise” within the context of a primary uptrend.
I’d encourage you to avoid the temptation of labeling this chart as a head and shoulders topping pattern, because one of the key aspects of this pattern is a symmetry between the two halves of the pattern. For the QQQ, I wouldn’t consider the highs to the left and right of the July peak to be similar enough to label this as a head and shoulders top. However, a neckline based off that pattern would indicate potential support around the 200-day moving average.
3/
Countertrend Rally in Play for Energy Stocks?
One thing I’ve learned over my career is that when crude oil prices are heading lower, energy stocks tend to be a pretty bearish trade. And 2024 has played out pretty much exactly as you’d expect given the weakness in the chart of crude oil.
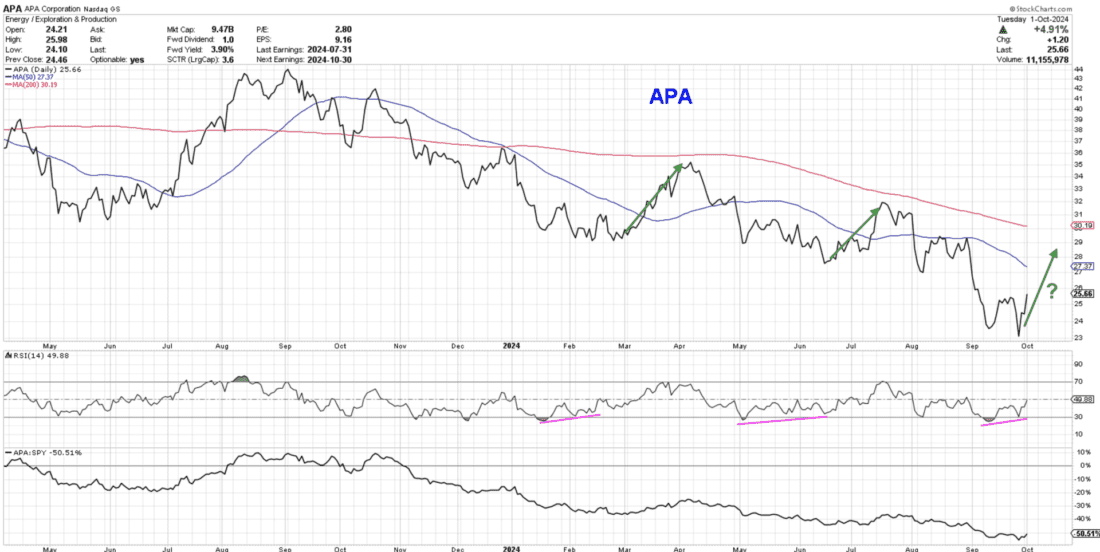
But at some point, energy stocks in primary downtrends often flash some contrarian bullish signals, as we are noting this week on the chart of APA Corporation (APA).

Courtesy of StockCharts.com
Past performance is not indicative of future results
In February of this year, then again in June, we noticed a bullish momentum divergence. This is when the price makes a lower low but the momentum indicator, in this case RSI, makes a higher low. This divergence implies that downside pressure is alleviated and an upswing may be imminent.
Previous signals in February and June resulted in a brief upswing to test the 200-day moving average. As we’ve seen a similar bullish divergence in September, APA may be setting up for a countertrend move in the coming weeks. As the two previous upturns ended with the RSI reaching the overbought level, the RSI indicator could provide an effective way to track any upside reaction to the recent bullish signal.
—
Originally posted 2nd October 2024
Disclosure: Investopedia
Investopedia.com: The comments, opinions and analyses expressed herein are for informational purposes only and should not be considered individual investment advice or recommendations to invest in any security or to adopt any investment strategy. While we believe the information provided herein is reliable, we do not warrant its accuracy or completeness. The views and strategies described on our content may not be suitable for all investors. Because market and economic conditions are subject to rapid change, all comments, opinions and analyses contained within our content are rendered as of the date of the posting and may change without notice. The material is not intended as a complete analysis of every material fact regarding any country, region, market, industry, investment or strategy. This information is intended for US residents only.
Disclosure: Interactive Brokers Third Party
Information posted on IBKR Campus that is provided by third-parties does NOT constitute a recommendation that you should contract for the services of that third party. Third-party participants who contribute to IBKR Campus are independent of Interactive Brokers and Interactive Brokers does not make any representations or warranties concerning the services offered, their past or future performance, or the accuracy of the information provided by the third party. Past performance is no guarantee of future results.
This material is from Investopedia and is being posted with its permission. The views expressed in this material are solely those of the author and/or Investopedia and Interactive Brokers is not endorsing or recommending any investment or trading discussed in the material. This material is not and should not be construed as an offer to buy or sell any security. It should not be construed as research or investment advice or a recommendation to buy, sell or hold any security or commodity. This material does not and is not intended to take into account the particular financial conditions, investment objectives or requirements of individual customers. Before acting on this material, you should consider whether it is suitable for your particular circumstances and, as necessary, seek professional advice.
Disclosure: ETFs
Any discussion or mention of an ETF is not to be construed as recommendation, promotion or solicitation. All investors should review and consider associated investment risks, charges and expenses of the investment company or fund prior to investing. Before acting on this material, you should consider whether it is suitable for your particular circumstances and, as necessary, seek professional advice.
Disclosure: Mutual Funds
Not all funds are available to retail investors. Mutual Funds are investments that pool the funds of investors to purchase a range of securities to meet specified objectives, such as growth, income or both. Investors are reminded to consider the various objectives, fees, and other risks associated with investing in Mutual Funds. Please read the prospectus accordingly. This communication is not to be construed as a recommendation, solicitation or promotion of any specific fund, or family of funds. Interactive Brokers may receive compensation from fund companies in connection with purchases and holdings of mutual fund shares. Such compensation is paid out of the funds' assets. However, IBKR does not solicit you to invest in specific funds and does not recommend specific funds or any other products to you. For additional information please visit the Mutual Funds section of your local Interactive Brokers website.
Disclosure: Futures Trading
Futures are not suitable for all investors. The amount you may lose may be greater than your initial investment. Before trading futures, please read the CFTC Risk Disclosure. A copy and additional information are available at the Warnings and Disclosures section of your local Interactive Brokers website.


Join The Conversation
If you have a general question, it may already be covered in our FAQs page. go to: IBKR Ireland FAQs or IBKR U.K. FAQs. If you have an account-specific question or concern, please reach out to Client Services: IBKR Ireland or IBKR U.K..
Visit IBKR U.K. Open an IBKR U.K. Account