By Vishal Dalvi, CMT
1/ RAMCOCEM Yearly Chart
2/ RAMCOCEM Monthly Chart
3/ RAMCOCEM Weekly Chart
4/ RAMCOCEM Futures Weekly Chart
Investopedia is partnering with CMT Association on this newsletter. The contents of this newsletter are for informational and educational purposes only, however, and do not constitute investing advice. The guest authors, which may sell research to investors, and may trade or hold positions in securities mentioned herein do not represent the views of CMT Association or Investopedia. Please consult a financial advisor for investment recommendations and services.
1/
RAMCOCEM Yearly Chart
In the Long run stocks prices are slaves of Earnings and history has enough evidence to show that Fundamental Investing has been a profitable long-term strategy for wealth creation. But one can successfully invest for the long-term using Technical Analysis too.
There are several strategies to finding stocks for investing using Technical Analysis; I am going to discuss one of the strategies I use. Let’s look at the set up using RAMCOCEM.
- Long Term Uptrend should be Intact
- Minimal/Negative returns in recent years signaling Consolidation in a broad range
- Rise in Delivery Volumes
- Rise in Cumulative Open Interest ( If Future contract available)
Past performance is not indicative of future results
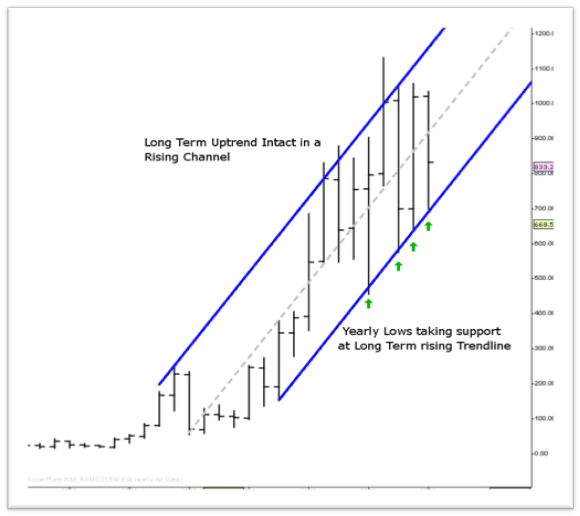
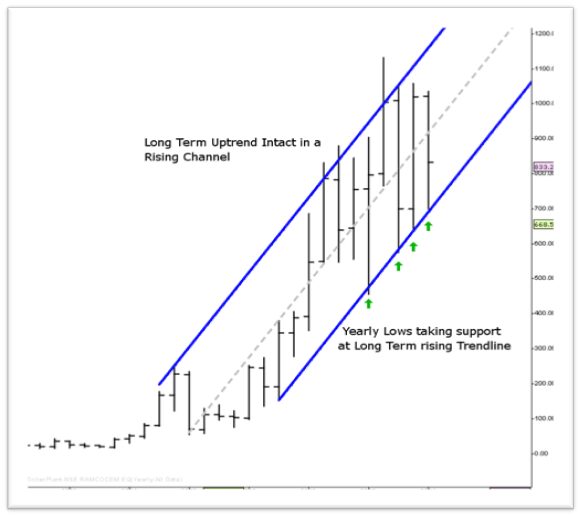
Long Term uptrend is intact for the stock. Prices continue to rise in the up trending Channel and yearly lows for last few bars have been taking exact support at the rising uptrend line.
2/
RAMCOCEM Monthly Chart
Past performance is not indicative of future results
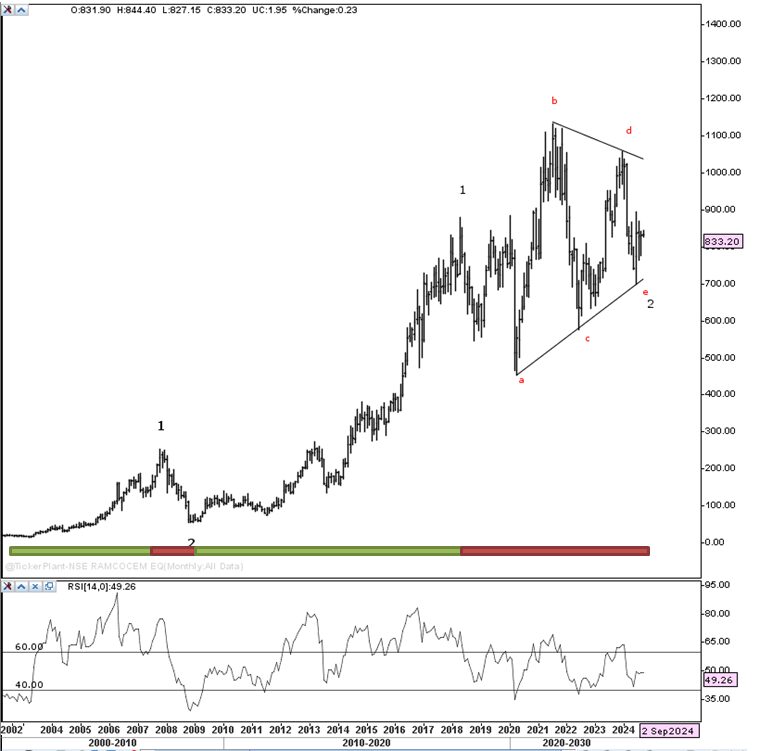
Elliott Wave Principle (EWP) shows that stock may have finished its corrective phase in the form of a Running Triangle around 700. Instead of putting a wave count to every small move, one can simply look at whether the up moves are impulsive (Internally 5 waves) and fall/corrections are corrective (overlapping) in nature. As long as that structure hold the long term uptrend should continue. As long as above 700 levels, wave 3 should take prices to a new high. Fall below 700 may negate this wave count.
3/
RAMCOCEM Weekly Chart
Past performance is not indicative of future results
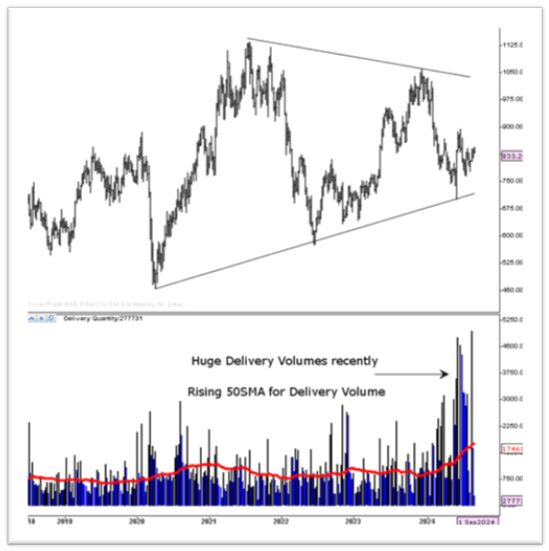
Huge Delivery Volumes are strong leading indicators to a potential large move in the stock. It’s a sign of smart money entering the stock. What is important is that the delivery volume is a high cluster for months and not just for few trading sessions. A good way of checking that is to plot a 50 period moving average on Volumes and the average line should rise at least two times of its past historical mean.
4/
RAMCOCEM Futures Weekly Chart
Past performance is not indicative of future results
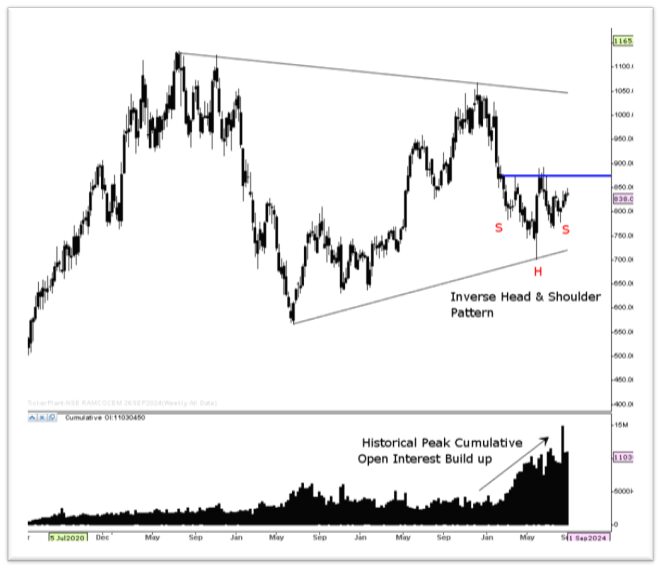
Since a Future contract is also traded for this stock, Cumulative Open Interest can give significant insight into the stock. Open interest build up is at historical high levels and have spiked recently to more than double than its historical averages. This is a strong precursor to a big move coming in the stock as it shows huge interest and participation in the stock. A warning note is that Open interest build up by itself cannot gives any clues to the direction in which the stock may move, and it has to be seen along with Price action confirmation.
The Weekly Chart also shows an Inverse Head and Shoulder pattern and a break above 890 levels, should trigger start of a multiyear run up in the stock. Long Term breakout is above 1050 level. 700 remains a critical Risk management level.
—-
Originally posted 4th September 2024
Disclosure: Investopedia
Investopedia.com: The comments, opinions and analyses expressed herein are for informational purposes only and should not be considered individual investment advice or recommendations to invest in any security or to adopt any investment strategy. While we believe the information provided herein is reliable, we do not warrant its accuracy or completeness. The views and strategies described on our content may not be suitable for all investors. Because market and economic conditions are subject to rapid change, all comments, opinions and analyses contained within our content are rendered as of the date of the posting and may change without notice. The material is not intended as a complete analysis of every material fact regarding any country, region, market, industry, investment or strategy. This information is intended for US residents only.
Disclosure: Interactive Brokers Third Party
Information posted on IBKR Campus that is provided by third-parties does NOT constitute a recommendation that you should contract for the services of that third party. Third-party participants who contribute to IBKR Campus are independent of Interactive Brokers and Interactive Brokers does not make any representations or warranties concerning the services offered, their past or future performance, or the accuracy of the information provided by the third party. Past performance is no guarantee of future results.
This material is from Investopedia and is being posted with its permission. The views expressed in this material are solely those of the author and/or Investopedia and Interactive Brokers is not endorsing or recommending any investment or trading discussed in the material. This material is not and should not be construed as an offer to buy or sell any security. It should not be construed as research or investment advice or a recommendation to buy, sell or hold any security or commodity. This material does not and is not intended to take into account the particular financial conditions, investment objectives or requirements of individual customers. Before acting on this material, you should consider whether it is suitable for your particular circumstances and, as necessary, seek professional advice.
Disclosure: Futures Trading
Futures are not suitable for all investors. The amount you may lose may be greater than your initial investment. Before trading futures, please read the CFTC Risk Disclosure. A copy and additional information are available at the Warnings and Disclosures section of your local Interactive Brokers website.
Disclosure: Options Trading
Options involve risk and are not suitable for all investors. For information on the uses and risks of options read the "Characteristics and Risks of Standardized Options" also known as the options disclosure document (ODD). Multiple leg strategies, including spreads, will incur multiple transaction costs.
Disclosure: Bonds
As with all investments, your capital is at risk.
Disclosure: ETFs
Any discussion or mention of an ETF is not to be construed as recommendation, promotion or solicitation. All investors should review and consider associated investment risks, charges and expenses of the investment company or fund prior to investing. Before acting on this material, you should consider whether it is suitable for your particular circumstances and, as necessary, seek professional advice.







Join The Conversation
If you have a general question, it may already be covered in our FAQs page. go to: IBKR Ireland FAQs or IBKR U.K. FAQs. If you have an account-specific question or concern, please reach out to Client Services: IBKR Ireland or IBKR U.K..
Visit IBKR U.K. Open an IBKR U.K. Account