


Originally posted, 20 March 2025 – Copper: Major Factors That Offer Two Opposing Price Scenarios
Copper has been an outperformer among commodities, but can its 20% surge from the end of 2024 last? The answer boils down to how various demand and supply-side factors shake out in coming years. Among the demand factors likely to drive copper are generative AI’s thirst for electricity, adoption of EVs and the evolution of solar, wind and battery technology alongside traditional demand sources like the construction of residential and commercial property. In addition, the demand factors are colliding with extremely slow growth in copper mining supply.
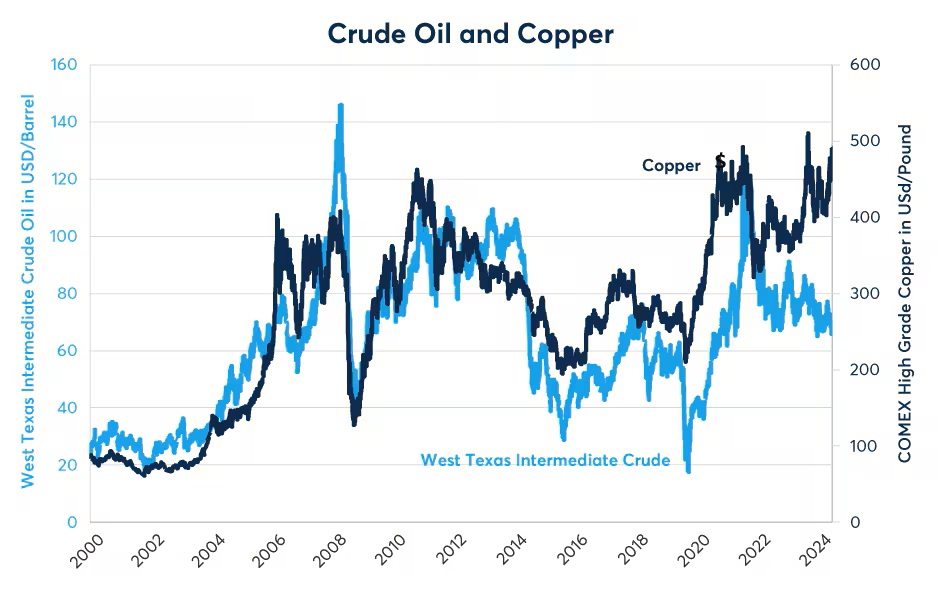
But before we focus on those factors, it is worth noting the extent to which copper, widely considered to reflect the state of the global economy because of its varied uses, has diverged from two of its most traditional price drivers: crude oil and the pace of growth in China.
Copper’s relationship with crude oil and China
From 2000 to 2022, the price of copper closely tracked crude oil. This may have been because copper is extremely energy intensive to mine and refine. As such, crude oil prices served as a proxy for copper’s cost of production. However, in late 2022, around the time the U.S. Congress passed the Inflation Reduction Act, copper prices began to head higher even as crude oil prices began falling. Nearly two and a half years later, that divergent trend is still in place (Figure 1).
Figure 1: Divergent trend in crude oil-copper still in place
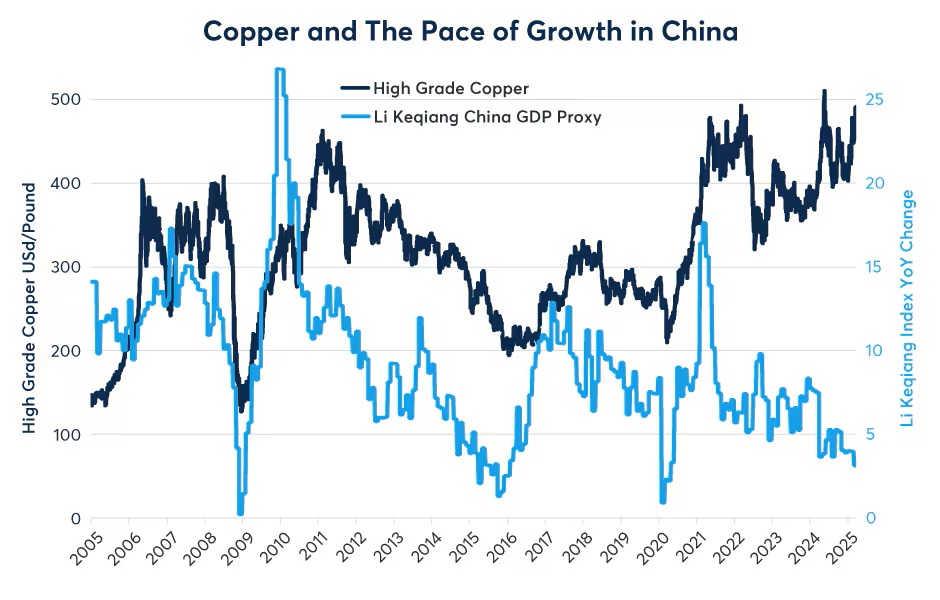
Up until 2022, copper often tracked China’s growth rate, sometimes with a lag of as much as one year. China is a major importer of copper for use in its construction sector and other industries. When China’s growth rate crested in 2007, 2010, 2017 and 2021, copper prices were usually at high levels and often peaked within six to 12 months. Since 2022, that relationship has also broken down, with Chinese growth slowing sharply even as copper prices headed to new record highs (Figure 2). It is worth noting, however, that the Chinese government is considering stimulus measures. Should these succeed in boosting Chinese growth, that could add fuel to copper’s bull market.
Figure 2: Copper prices have diverged from the pace of growth in China
Copper, AI, EVs and the Energy Transition
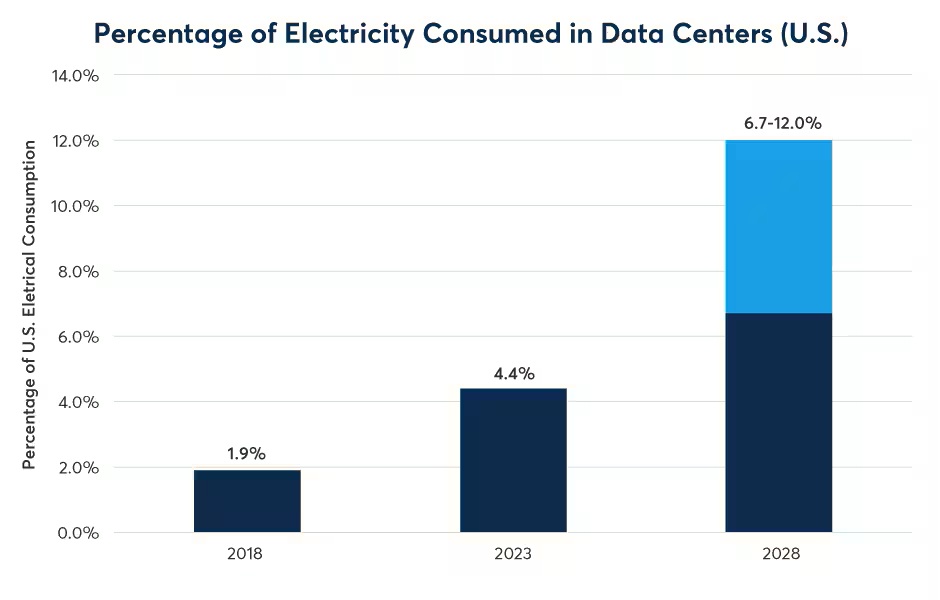
Recently, we wrote on the topic of how technological change has been slowing the demand for crude oil and refined products here. The opposite has been true for copper. Generative AI, EVs as well as rapidly falling costs for alternative energy are boosting demand for electricity, and by extension for copper. Take AI as an example. Back in 2018, data centres in the U.S. accounted for 1.9% of electricity consumption. By 2023, the year that many of the most advanced generative AIs began to be widely adopted, data centers’ share of electricity consumption grew to 4.4%. By 2028, that could grow further to 6.7% to 12%, according to the U.S. Department of Energy projections (Figure 3). This implies a tremendous increase in demand for electricity, electrical transmission and hence for copper. But data centers are just one aspect of the technological changes sweeping the world.
Figure 3: Generative AI’s thirst for electricity is boosting electricity demand
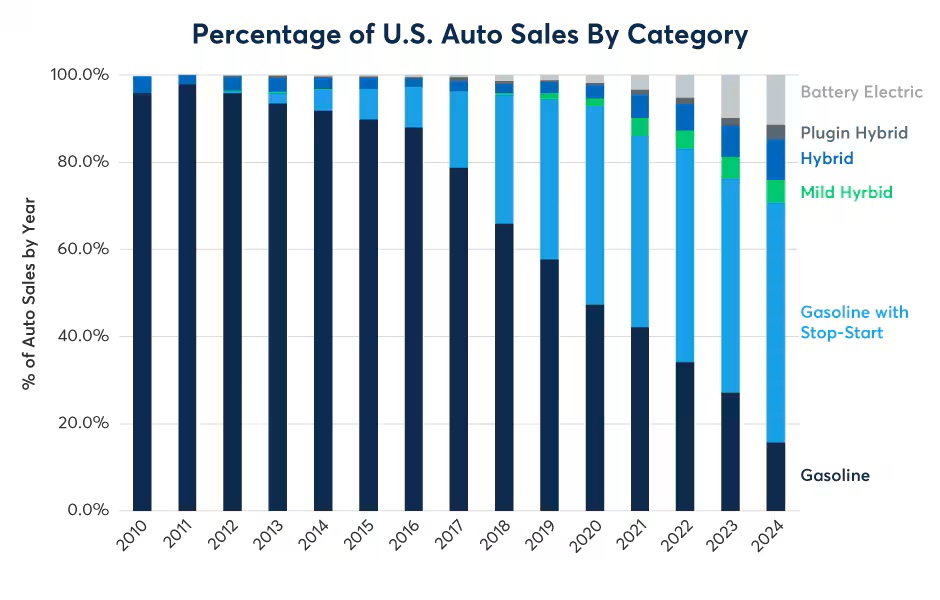
EVs have been gaining a larger and larger foothold among the world’s consumers. Back in 2010, EVs were close to 0% of the U.S. auto market. By 2024, they had risen to 11.4% of total vehicle sales. Hybrids also saw a sharp rise in sales as well (Figure 4). The average EV contains 60kg of copper compared to 40kg for hybrids and just 24kg in the average combustion engine car. Of course, copper is also the key component in EV recharging stations.
Figure 4: In the U.S., EVs and hybrids are gaining market share
Meanwhile, China has been the global leader in EVs with sales accounting for 35% of total vehicle sales in 2023 and over 50% in 2024. As such, even if U.S. EV demand slows, the appeal for these vehicles appears set to grow globally.
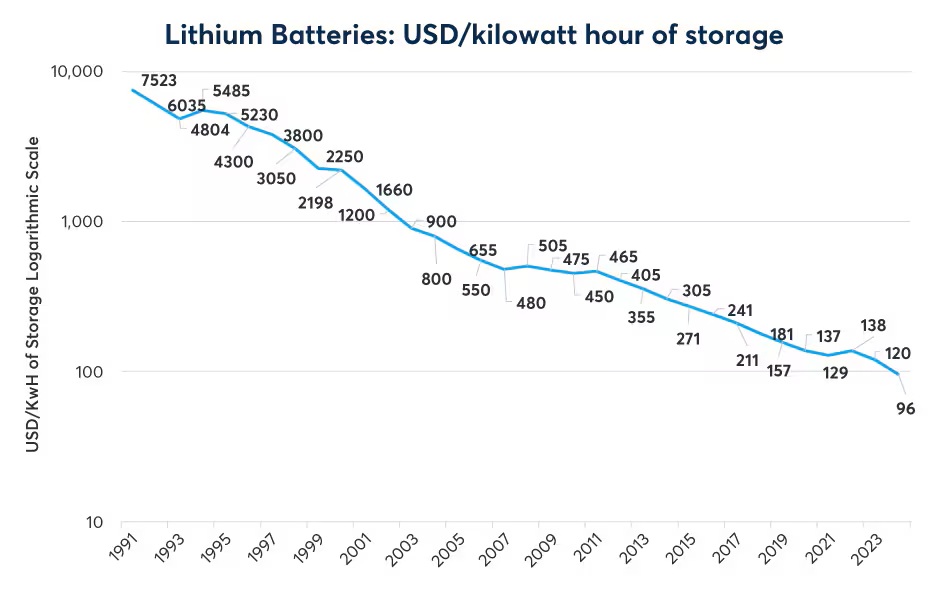
The technology of electricity generation is also rapidly evolving. While natural gas, coal and fossil fuel supply much of the world’s energy, solar and wind have been gaining market share as costs have fallen by as much as 60% per decade (Figure 5). In parallel, there has been a similar pace of decline in the cost of lithium-ion battery storage (Figure 6).
Figure 5: Solar and wind energy gaining market share
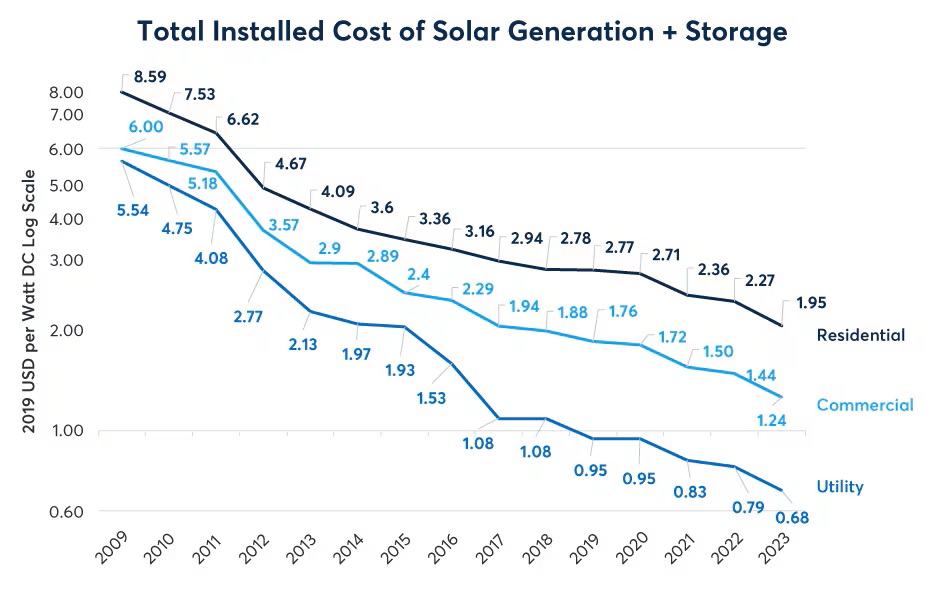
Figure 6: There has been a decline in the cost of storing lithium-ion batteries
Copper Supply
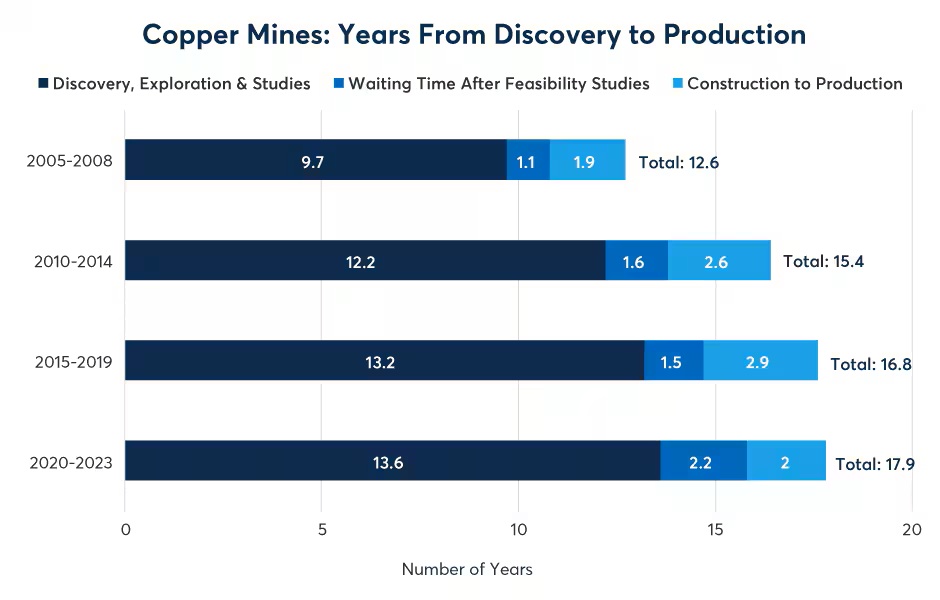
These sources of rising demand for copper come at a time of limited supply. In comparison to metals and alloys such as aluminum and iron and steel, copper supplies have been growing at a slow pace of around 1.2% per year since 2016 (Figure 7). Moreover, it does not appear as though many new mines are set to enter production soon. On average, it takes nearly 18 years to bring a new copper mine into production, and the time to bring to market has steadily risen in recent decades (Figure 8). As such, copper may remain a demand-driven market with prices fluctuating mainly in response to changes in industry needs for the red metal.
Figure 7: Copper supply growth has been limited
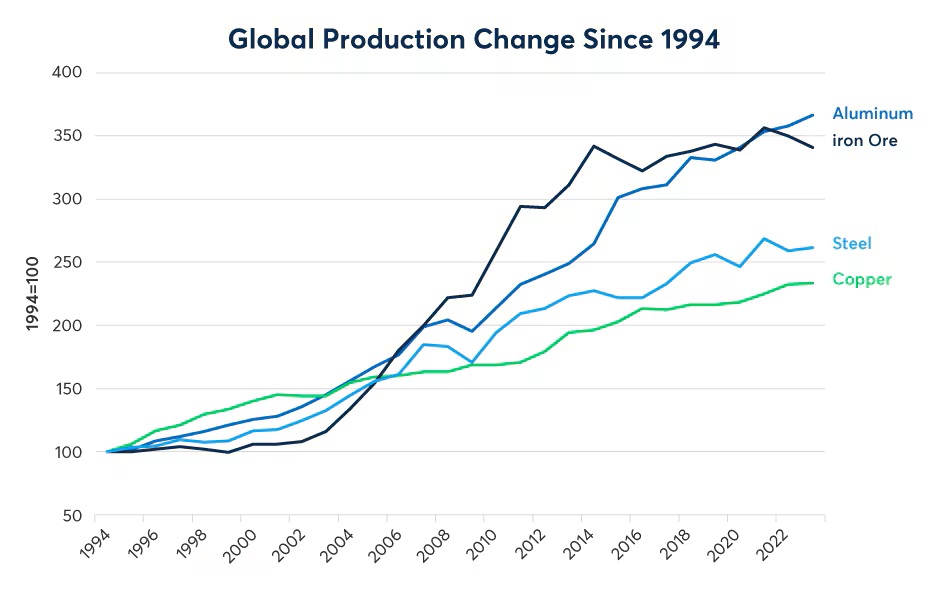
Figure 8: The length of time to market for new supplies of copper has been growing
This isn’t to say that everything has been looking up for copper. The supply growth of new housing, which was the main driver of copper prices back in the 1980s and 1990s, has been soft since the global financial crisis. China’s construction sector has been contracting by 10% per year for the past two years. Moreover, home construction in the U.S. and Europe never fully recovered from the global financial crisis. Construction demand could be strong in places like India with growing populations and solid economic growth but won’t likely be robust in places like China, Japan, South Korea and most of Europe which have inverted demographic pyramids, with fewer young people and an abundance of middle-aged workers and retirees.
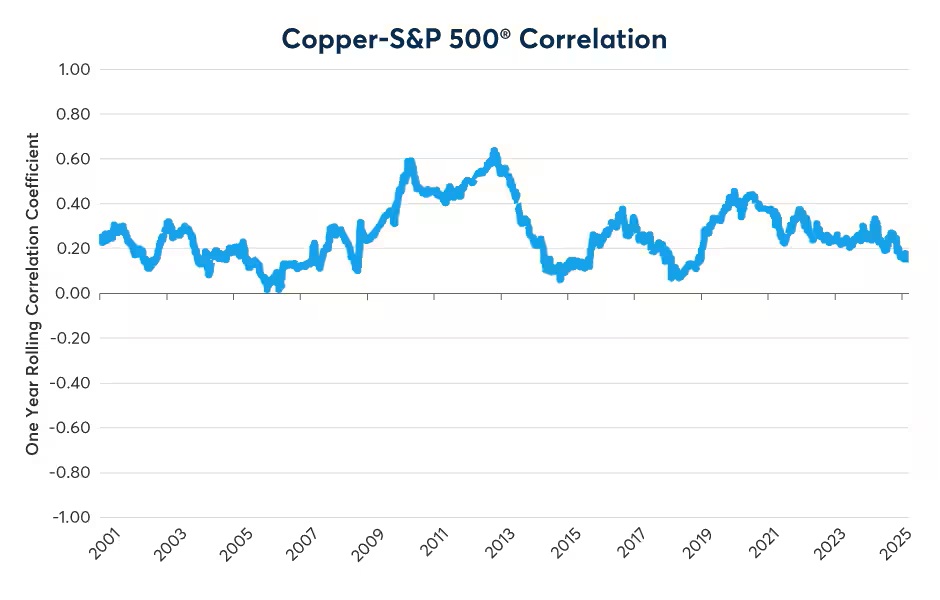
But watch out for equities. Copper traditionally has had a positive correlation with U.S. stocks. (Figure 9). If U.S. equities continue to sell off, eventually that could translate into reduced copper demand.
Figure 9: Dr. Copper isn’t immune to fluctuations in U.S. equities
Bottom Line: Key Upside and Downside Risks
Upside Risks for Copper Include:
- Rapid growth in electricity demand stemming from AI
- The continued adoption of EVs around the world
- Falling costs for solar and wind energy and lower costs for battery storage
- A construction boom in India which would replace soft Chinese demand
- A successful Chinese stimulus package could fuel copper’s continued rise
- Fiscal easing in Germany focused on infrastructure and defense could boost European growth as well
- Potentially slow continued growth in copper mining supply could cause a global scramble for tight supplies
- Many countries (Australia, Canada, France, the U.K. and U.S.) face housing shortages which could add to residential construction demand
Downside Risks for Copper Include:
- A sharp correction or possible bear market in U.S. equities
- Policy changes that are less favorable to EVs
- The high price of copper could incentivize exploration and new mining development
- Falling oil prices could lower the cost of production and incentivize future supply growth
- Slower global growth due to increased protectionism and trade wars
Disclosure: CME Group
© [2023] CME Group Inc. All rights reserved. This information is reproduced by permission of CME Group Inc. and its affiliates under license. CME Group Inc. and its affiliates accept no liability or responsibility for the information contained herein, including but not limited to the currency, accuracy and/or completeness of this information, and delays, interruptions, errors or omissions. This information is an unofficial copy and may not reflect the official and accurate version. For the definitive and up-to-date version of any of this information, please see cmegroup.com.
Disclosure: Interactive Brokers Third Party
Information posted on IBKR Campus that is provided by third-parties does NOT constitute a recommendation that you should contract for the services of that third party. Third-party participants who contribute to IBKR Campus are independent of Interactive Brokers and Interactive Brokers does not make any representations or warranties concerning the services offered, their past or future performance, or the accuracy of the information provided by the third party. Past performance is no guarantee of future results.
This material is from CME Group and is being posted with its permission. The views expressed in this material are solely those of the author and/or CME Group and Interactive Brokers is not endorsing or recommending any investment or trading discussed in the material. This material is not and should not be construed as an offer to buy or sell any security. It should not be construed as research or investment advice or a recommendation to buy, sell or hold any security or commodity. This material does not and is not intended to take into account the particular financial conditions, investment objectives or requirements of individual customers. Before acting on this material, you should consider whether it is suitable for your particular circumstances and, as necessary, seek professional advice.


Join The Conversation
If you have a general question, it may already be covered in our FAQs page. go to: IBKR Ireland FAQs or IBKR U.K. FAQs. If you have an account-specific question or concern, please reach out to Client Services: IBKR Ireland or IBKR U.K..
Visit IBKR U.K. Open an IBKR U.K. Account