


Originally posted 8 June 2026 – Beyond Demand, Supply’s Pivotal Role in Gold, Silver Prices
Demand drivers such as central bank purchasing trends, the U.S. dollar exchange rate, interest rates, and inflation tend to hold sway over gold and silver markets, often overshadowing supply-side dynamics that can be equally vital to price discovery.
In recent years, the mining supply for both metals has stagnated or declined even as investment demand has surged. Gold mining supply peaked in 2017 at 106 million troy ounces and has since declined by nearly 10% to 96.8 million troy ounces (Figure 1). Likewise, silver mining production peaked in 2016 at 873.3 million troy ounces and has since dropped to 797.7 million troy ounces – a decline of roughly 9% (Figure 2).

Source: CPM Group Gold Yearbook 2026 (Past performance is not indicative of future results)
Figure 2: Silver mining production peaked a decade ago and has since fallen by 9%
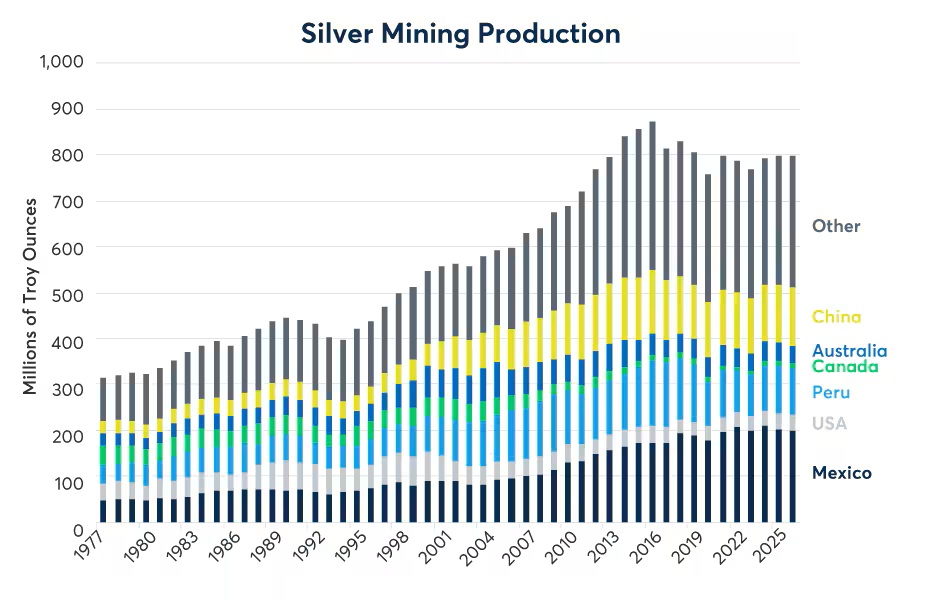
Source: CPM Group Silver Yearbook 2026 (Past performance is not indicative of future results)
Inflation-adjusted gold prices reveal a roughly inverse relationship with the growth rate of “gold money supply” – the amount of physical gold across the globe that acts as a store of value, financial asset etc – which is calculated as the current year’s mining production divided by the outstanding supply of previously mined gold (Figure 3). Historically, periods of rapid supply growth tend to correspond with times of depressed gold prices, while periods of slow growth in the outstanding stock of gold correlate to periods of high prices.
Figure 3: The pace of gold supply growth varies inversely with gold prices
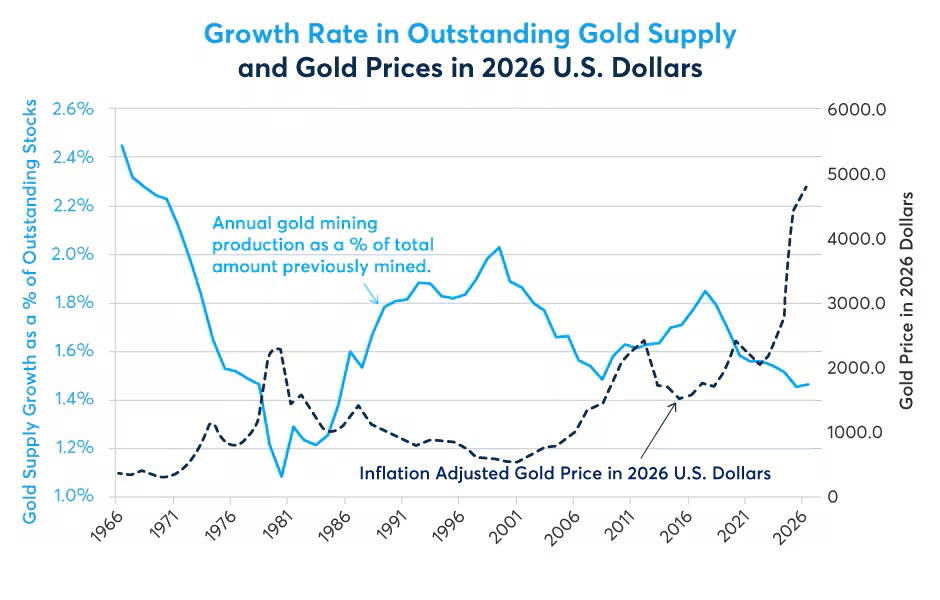
Source: CPM Gold Year Book 2026, Bloomberg Professional (GOLDS and CPI INDX) (Past performance is not indicative of future results)
Beyond isolated price relationships, the gold and silver markets interact with one another in fascinating ways regarding mining supply. To elucidate this, we utilized a simple econometric model, regressing the annual percentage change in gold and silver mining supply against the respective annual percentage change in the real (inflation-adjusted) prices of both metals.
The results indicate that while increases in mining supply negatively influence the prices of both metals, changes in gold mining supply exert a far greater influence on price than changes in silver mining supply (Figure 4). On average, from 1978 to 2026, a 1% increase in gold mining supply resulted in an estimated 1.70% decrease in its price and a notable 2.78% decline in the price of silver, all else being equal. In turn, a 1% rise in silver mining supply lowered the price of gold by approximately 1.24% and the price of silver by 0.79%. It’s also worth pointing out that the correlation between the annual growth rates of gold and silver mining supply is extremely low, around 0.11 since 1978. Therefore, there is no issue with multicollinearity insofar as the regression results are concerned.
Figure 4: Gold and silver react negatively to increases in each other’s mining supply

Source: Data From CPM 2024 Gold and Silver Yearbooks with Calculations from CME Group Economic Research (Past performance is not indicative of future results)
Our regression model suggests that 39% of the annual variation in gold prices and silver prices can be explained solely by changes in gold and silver mining supply.
That gold is the more influential metal of the two is structurally logical. While the world mines only around 97 million troy ounces of gold compared to nearly 800 million troy ounces of silver, the economic value of gold is vastly greater, with its price close to 60x that of silver. Based on early June 2026 prices, the annual value of gold’s mining output reaches close to $436 billion, while silver’s sits at around $60 billion.
That gold’s economic value is roughly 7.2x that of silver is one of two key factors explaining its dominant market influence. The second factor stems from their use cases. In many ways, gold and silver are entirely different assets. Silver possesses extensive industrial applications, including electronics, batteries, solar panels, and historically, photography (Figure 6). By contrast, gold has relatively few industrial applications. Where the two metals dovetail is through the jewelry and investment markets (Figure 5).
Figure 5: Most of the world’s gold is used for jewelry and investment
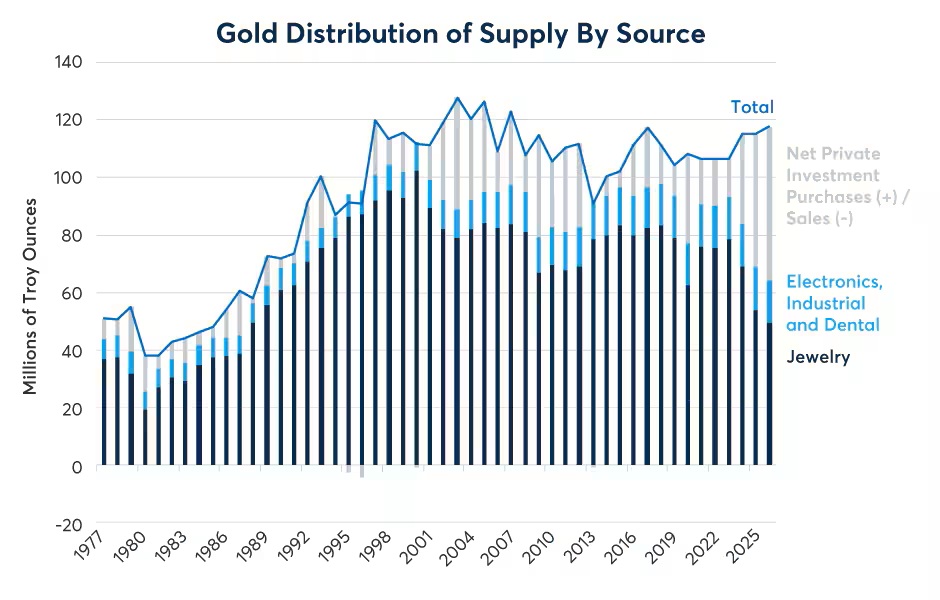
Source: CPM Group Gold Yearbook 2026 (Past performance is not indicative of future results)
Figure 6: Jewelry and investment are among the diverse applications of silver
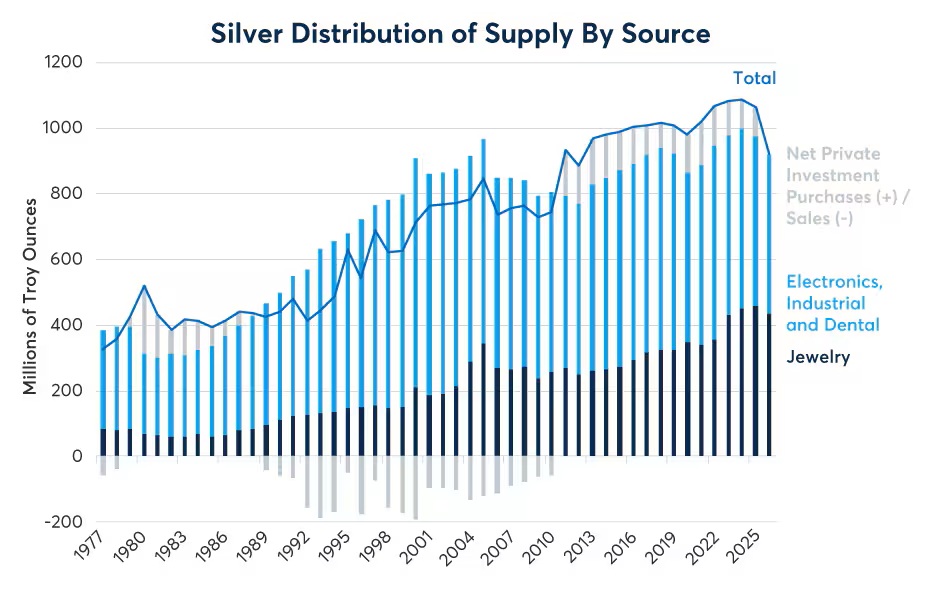
Source: CPM Group Silver Yearbook 2026 (Past performance is not indicative of future results)
One could object by noting that we have omitted secondary, or recycled, supply from the primary analysis. In 2025, recycled material accounted for 28% of the world’s gold supply and 29% of the silver supply (Figures 7 and 8). Curiously, however, secondary supply does not appear to behave as a downward price driver. Rather than causing prices to fall, higher levels of secondary supply correlate positively with higher prices in our statistical analysis. Essentially, as prices climb, the economic incentive to recycle material increases. This suggests that market participants view secondary supply as gold that has already been accounted for by the market, rather than a novel source of downward pressure.
Figure 7: Secondary supply was 28% of overall gold supply amid higher prices

Source: CPM Group Gold Yearbook 2026 (Past performance is not indicative of future results)
Figure 8: Secondary supply accounts for 29% of overall silver supply in 2025
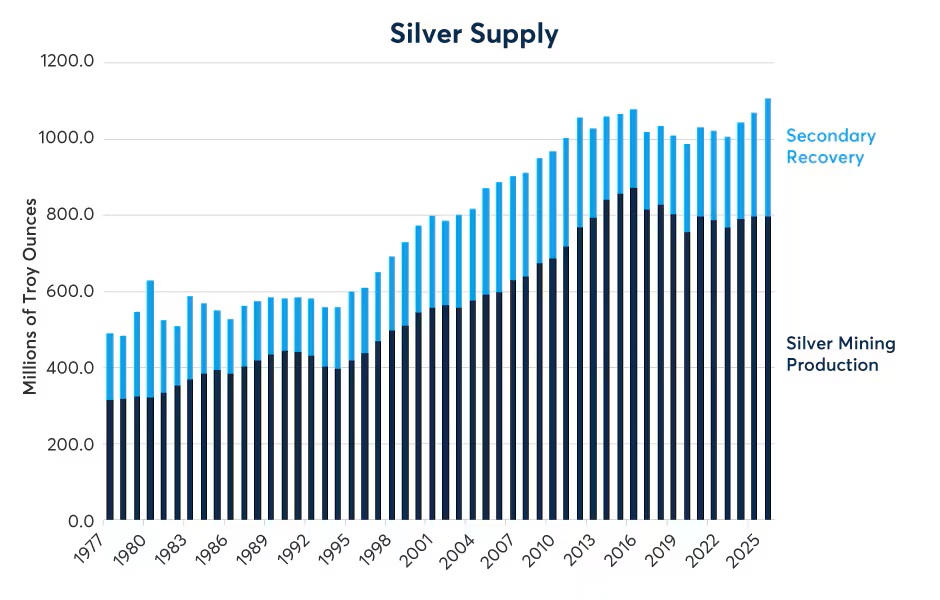
Source: CPM Group Silver Yearbook 2026 (Past performance is not indicative of future results)
While secondary production responds positively to price increases, how they are used show a distinct negative correlation with price changes. This is especially true in the jewelry market, where gold buyers exhibit extreme price sensitivity. This negative correlation is somewhat less pronounced for silver – given that silver trades at a fraction of the cost of gold, a significant percentage move in silver still leaves finished objects relatively affordable.
Other sectors show varying degrees of price elasticity. The dental use of gold shows a strong negative sensitivity to price, accelerated by the industry’s shift toward ceramics. Conversely, the utilization of gold and silver in electronics, heavy industrial applications, and solar panels appears to be far less price-sensitive (Figure 9).
Figure 9: Secondary supply responds positively to price. Gold and silver are lined via the jewelry markets
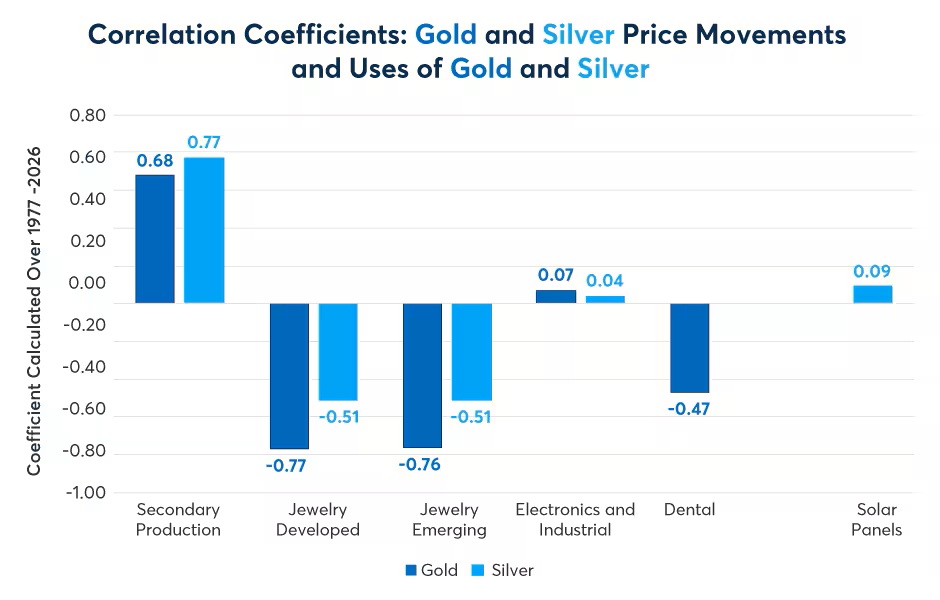
Source: Raw Data From CPM Group Gold and Silver Yearbooks 2026, Calculations by CME Group Economics Research (Past performance is not indicative of future results)
Ultimately, the deep structural connection between gold and silver is reflected in their price correlation. On a one-year rolling basis, the correlation between the two metals has consistently hovered around +0.8, ranging between +0.6 and +0.92 since the turn of the century (Figure 10).
Figure 10: The gold-silver correlation has been between +0.6 and +0.92 since 2000
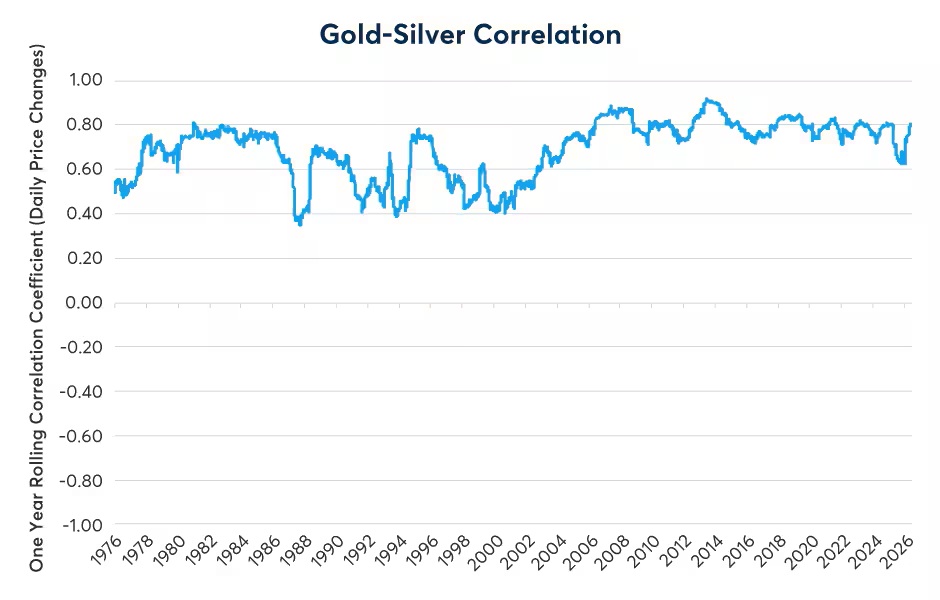
Source: Bloomberg Professional (GOLDS and XAG) with CME Group Economics Research Calculations (Past performance is not indicative of future results)
The precious metals market operates in a delicate balance between silver’s highly inelastic industrial demands – such as solar and electronics – and gold’s monetary and luxury demand, with both metals deeply intertwined via the commercial jewelry markets. Our econometric modeling suggests that supply-side dynamics have significant explanatory power, accounting for nearly 40% of the variations in average annual prices from year to year. Gold remains the anchor of the relationship due to its 7.2x economic scale advantage. Furthermore, because secondary recycled supply acts as an effect of high prices rather than a cause of low prices, primary mining output remains the fundamental supply metric that market participants must monitor to gauge long-term market equilibrium. Finally, the lack of mining supply growth is among reasons why prices have risen as far as they have in recent years.
All examples in this report are hypothetical interpretations of situations and are used for explanation purposes only. The views in this report reflect solely those of the author and not necessarily those of CME Group or its affiliated institutions. This report and the information herein should not be considered investment advice or the results of actual market experience.
Disclosure: CME Group
© [2023] CME Group Inc. All rights reserved. This information is reproduced by permission of CME Group Inc. and its affiliates under license. CME Group Inc. and its affiliates accept no liability or responsibility for the information contained herein, including but not limited to the currency, accuracy and/or completeness of this information, and delays, interruptions, errors or omissions. This information is an unofficial copy and may not reflect the official and accurate version. For the definitive and up-to-date version of any of this information, please see cmegroup.com.
Disclosure: Interactive Brokers Third Party
Information posted on IBKR Campus that is provided by third-parties does NOT constitute a recommendation that you should contract for the services of that third party. Third-party participants who contribute to IBKR Campus are independent of Interactive Brokers and Interactive Brokers does not make any representations or warranties concerning the services offered, their past or future performance, or the accuracy of the information provided by the third party. Past performance is no guarantee of future results.
This material is from CME Group and is being posted with its permission. The views expressed in this material are solely those of the author and/or CME Group and Interactive Brokers is not endorsing or recommending any investment or trading discussed in the material. This material is not and should not be construed as an offer to buy or sell any security. It should not be construed as research or investment advice or a recommendation to buy, sell or hold any security or commodity. This material does not and is not intended to take into account the particular financial conditions, investment objectives or requirements of individual customers. Before acting on this material, you should consider whether it is suitable for your particular circumstances and, as necessary, seek professional advice.


Join The Conversation
If you have a general question, it may already be covered in our FAQs page. go to: IBKR Ireland FAQs or IBKR U.K. FAQs. If you have an account-specific question or concern, please reach out to Client Services: IBKR Ireland or IBKR U.K..
Visit IBKR U.K. Open an IBKR U.K. Account