


Originally posted, 2 June 2025 – Are U.S. Small Caps Undervalued Relative to Larger S&P 500 Peers?
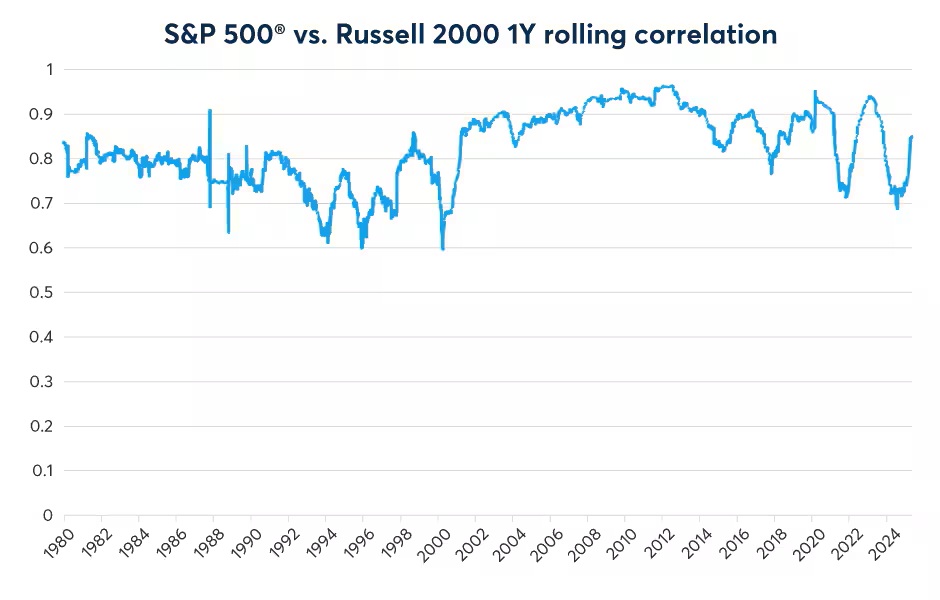
Are Russell 2000 small-cap companies undervalued relative to their larger peers in the S&P 500? Since the inception of the Russell 2000 time series in 1979, the index has largely mirrored gains in the S&P 500 (Figure 1). Indeed, on a day-to-day basis, the two indices are highly correlated: in recent years, the correlation has ranged from 0.7 to 0.95 on a one- year rolling basis (Figure 2).
Figure 1: Russell 2000 has largely kept pace with the S&P 500 since 1979
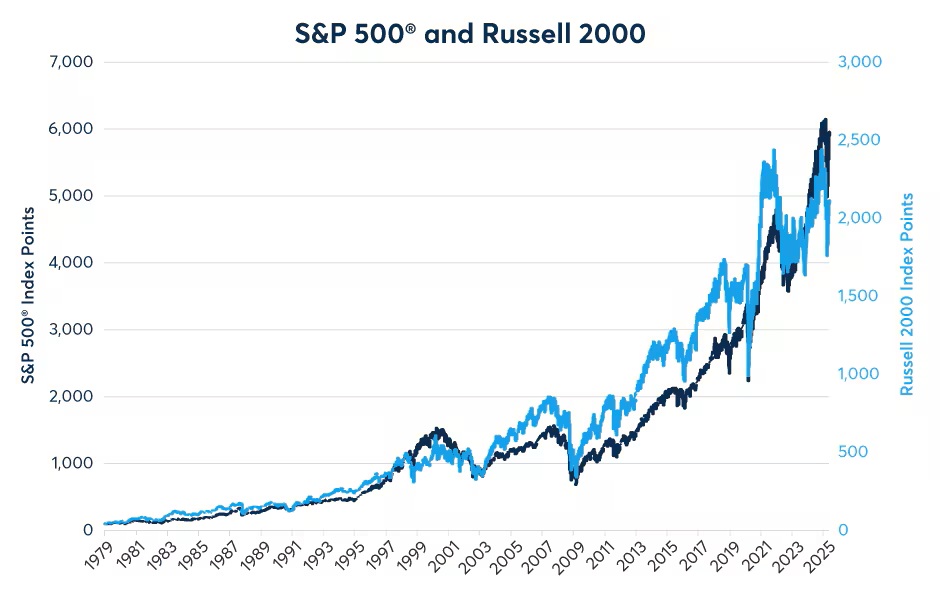
Past performance is not indicative of future results
Figure 2: Small-cap and large-cap stocks tend to be highly correlated
Despite the generally high correlation between the Russell 2000 and S&P 500, the ratio of the two indices has varied widely over time in accordance with the health of the economy. Small caps tend to outperform during recessions and early stages of economic recovery. In contrast, large caps tend to do better during the later stages of an economic expansion. The relative moves can be very large (Figure 3).
Figure 3: R2K outperformed during recessions, underperformed in late-stage expansions
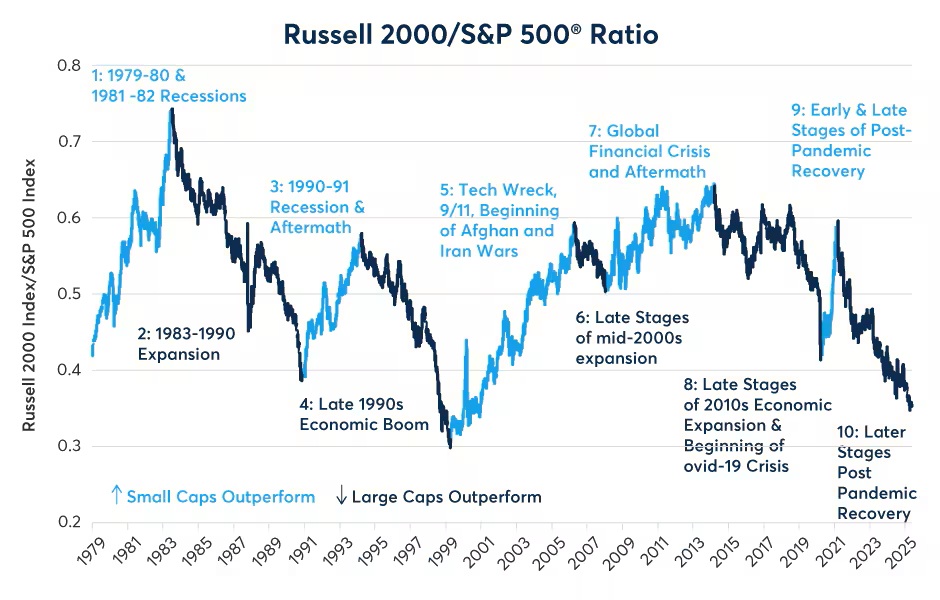
Past performance is not indicative of future results
- January 1979- July 1983: Russell 2000 outperformed by 77% amid a double-dip recession in 1979-80 and 1981-82 as well as during the initial period of the 1980s economic expansion. The Fed sharply raised rates in 1979 and 1980 and began easing in 1981 and 1982 as inflation fell.
- August 1983 – October 1990: The S&P 500 outperformed by 91.4% over the course of the 1980s expansion. The Fed kept rates high in real terms during this period.
- November 1990 – March 1994: The Russell 2000 outperformed by 49.6% during the 1990-1991 recession and during the early stages of the 1990s expansion. Between 1990 and 1993, the Fed lowered rates from nearly 10% to 3%.
- March 1994 – April 1999: The S&P 500 outperformed by 94.5% amid the late 1990s economic boom. The Fed raised rates from 3% to 6% by early 1995 and kept rates at 4.75% or higher for the rest of the period.
- April 1999 – April 2006: The Russell 2000 outperformed by 99% during the “tech wreck” recession of 2000-2002 and the initial stages of the relatively short 2003-2007 expansion. During this time, the Fed first slashed rates from 6.5% in 2000 to 1% by 2003 and did not begin tightening again until June 2004.
- April 2006 – January 2008: The S&P 500 outperformed by 18% during the late stages of the 2003-2007 expansion which ended in December 2007, according to the National Bureau of Economic Research. During this time, the Fed kept policy rates at around 5% until they began cutting in earnest in January 2008.
- January 2008 – March 2014: The Russell 2000 outperformed by 28.2% during the global financial crisis and the early stages of the recovery that followed. During this time the Fed slashed rates to near zero in 2008 and kept them there for seven years.
- March 2014 – March 2020: the S&P 500 outperformed by 56% during the late stages of the 2010s expansion and the beginning of pandemic lockdowns, which were initially seen as hurting small businesses more than large ones. During this time the Fed got rates as high as 2.375%.
- March 2020 – March 2021: Russell 2000 outperforms by 44.4% during the early stages of the post-pandemic recovery during which time inflation was initially low and interest rates remained near zero as the Fed conducted a dramatic balance sheet expansion.
- March 2021 – present: The S&P 500 has outperformed Russell 2000 by 69% over the past four years amid continued growth and rising interest rates.
Small-cap stocks’ tendency to outperform during recessions and early-stage expansions may be related to interest rate sensitivity. Smaller companies tend to borrow from banks rather than bond holders and the average duration of a business loan is less than two years. By contrast, companies in the S&P 500, most of which are investment grade, tend to issue bonds with an average duration of about 6.6 years. Even those that issue high-yield bonds have an average duration of 3.3 years (see our related article here). This means that large corporations tend to be more insulated from policy tightening that usually occurs during the later stages of an economic expansion. It also means that large-cap stocks tend to benefit more slowly from policy easing that occurs during recessions and the period of low rates that typically continue into the early stages of an economic recovery.
Another possibility is that smaller firms may be able to pivot more quickly when business conditions become volatile during periods of downturns. By contrast, larger firms may not be able to manoeuvre as quickly but might be better placed to benefit from long periods of continuous expansion.
What Dividend Futures Tell Us About Investor Expectations
S&P 500 and Russell 2000 dividend index futures give us an indication as to why investors have preferred large-cap stocks recently. Investors see modest growth ahead for S&P 500 dividend payments. Expressed in index points, S&P 500 firms paid out 75.09 points worth of dividends in 2024 and market pricing suggests that investors anticipate 79.25 index points worth of dividends in 2030. By contrast, investors are pricing that Russell 2000 firms will pay out only 27.25 index points worth of dividends in 2030, down from 29.31 in 2024 (Figure 4).
Figure 4: Investors are more optimistic about S&P 500 than R2K dividends
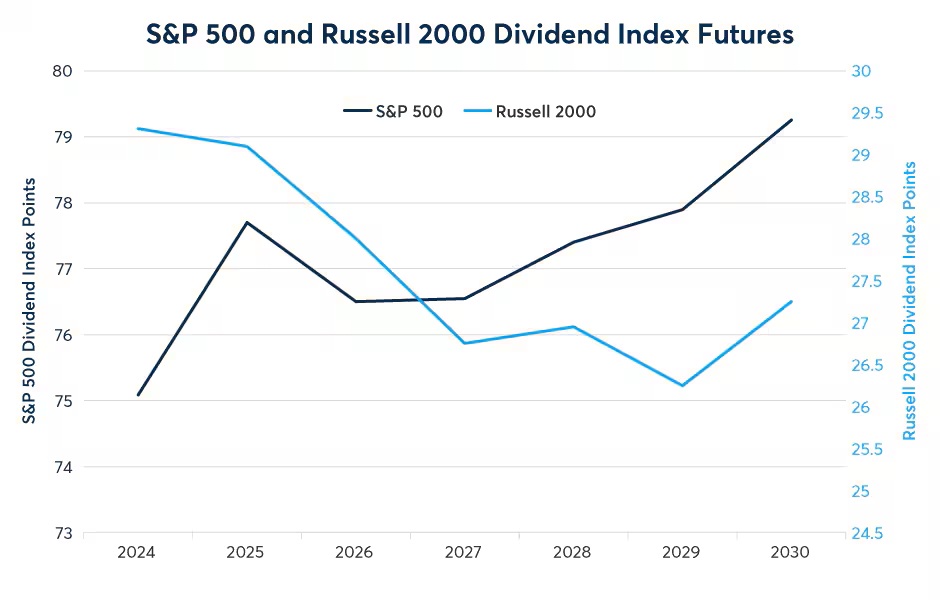
Past performance is not indicative of future results
Valuation Ratios
While small-cap stocks have underperformed larger companies, one warning sign is that small caps might still not be inexpensive when viewed from price earnings ratios. The S&P 500 trades at 24.17x trailing 12-month earnings. From this perspective, they are cheaper than R2K firms, which trade at 31.71x trailing earnings. S&P 500 firms are trading at 22.54x one-year ahead estimated earnings (using Bloomberg’s aggregated estimates from equity analysts) compared to 25.95 for R2K companies. This may be because many R2K companies are not consistently profitable. By contrast, the S&P 600 Small Cap Index, which screens for profitability, trades at 15.9x trailing earnings and 15.61 estimated one-year ahead earnings. This suggests that among the small-cap companies that meet the S&P 600 Small Cap Index criteria, they are trading at a substantial discount to their larger peers in the S&P 500.
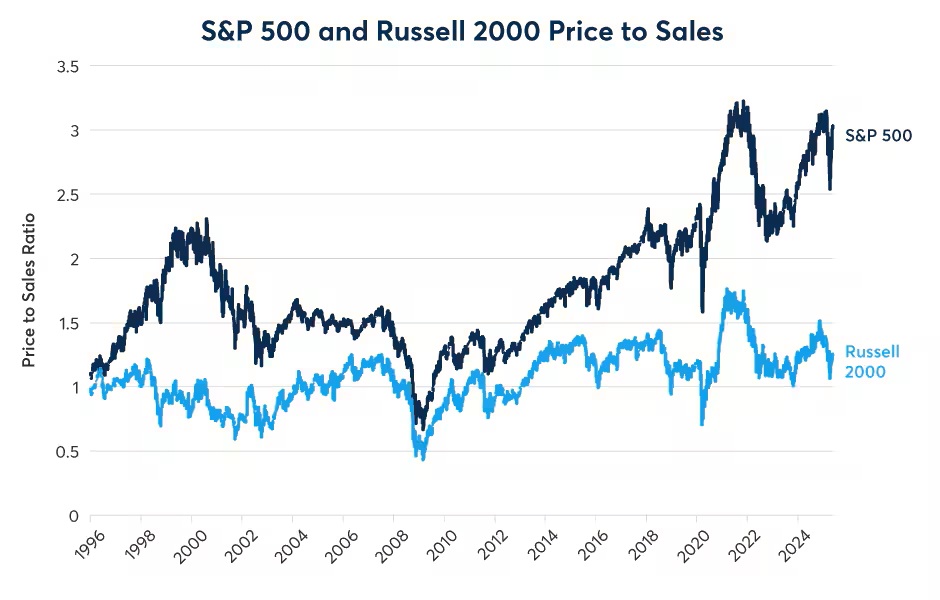
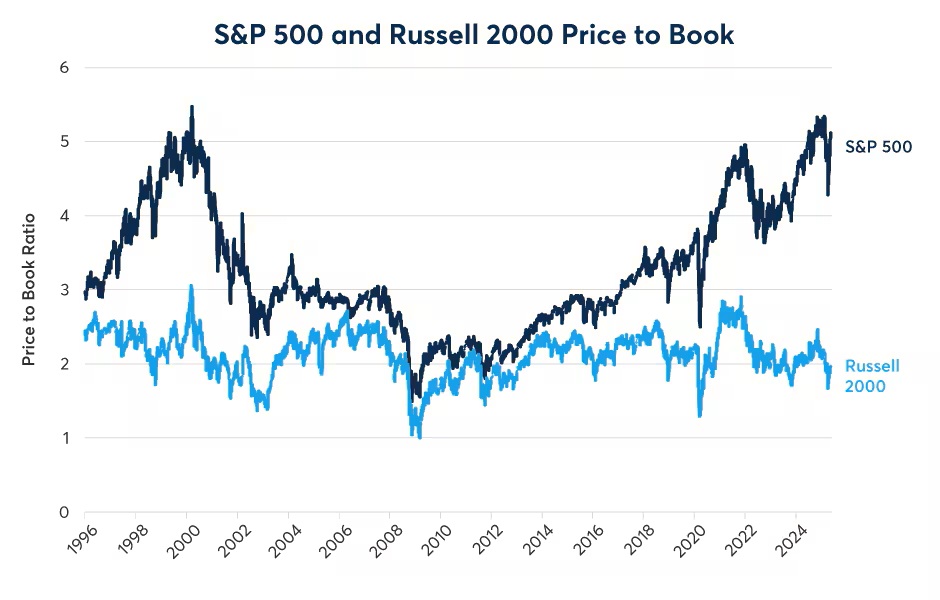
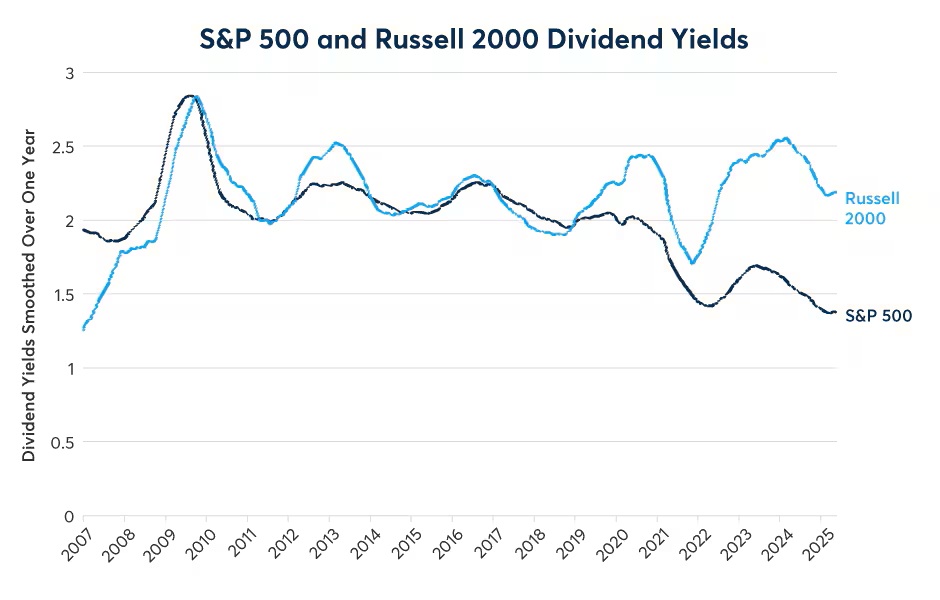
Meanwhile, other valuation ratios, such as price-to-sales and price-to-book, make Russell 2000 companies look like a bargain compared to those in the S&P 500 (Figures 5 and 6). The same is true when one looks at dividend yields, which are now higher for R2K firms than S&P 500 companies (Figure 7). By these measures, small caps have never been so cheap on a relative basis since 1999 – the beginning of a longer period of small cap outperformance.
Figure 5: R2K looks like a bargain on the prices to sales ratio basis
Past performance is not indicative of future results
Figure 6: R2K stocks also look like bargains on book-value basis
Figure 7: R2K stocks have recently begun paying higher dividends than S&P 500 firms
Past performance is not indicative of future results
Bottom Line
- The S&P 500 has outperformed the Russell 2000 since March 2021
- Large-cap stocks tend to outperform during late-stage economic expansion
- Small-caps stocks tend to outperform during recessions and early-stage recoveries
- S&P 500 dividend index futures paint a more optimistic view of future earnings and dividend payments than Russell 2000 dividend index futures
- S&P 500 firms have lower P/E ratios than Russell 2000 firms at the moment
- R2K firms are much cheaper when measured by price-to-sale or price-to-book
Disclosure: CME Group
© [2023] CME Group Inc. All rights reserved. This information is reproduced by permission of CME Group Inc. and its affiliates under license. CME Group Inc. and its affiliates accept no liability or responsibility for the information contained herein, including but not limited to the currency, accuracy and/or completeness of this information, and delays, interruptions, errors or omissions. This information is an unofficial copy and may not reflect the official and accurate version. For the definitive and up-to-date version of any of this information, please see cmegroup.com.
Disclosure: Interactive Brokers Third Party
Information posted on IBKR Campus that is provided by third-parties does NOT constitute a recommendation that you should contract for the services of that third party. Third-party participants who contribute to IBKR Campus are independent of Interactive Brokers and Interactive Brokers does not make any representations or warranties concerning the services offered, their past or future performance, or the accuracy of the information provided by the third party. Past performance is no guarantee of future results.
This material is from CME Group and is being posted with its permission. The views expressed in this material are solely those of the author and/or CME Group and Interactive Brokers is not endorsing or recommending any investment or trading discussed in the material. This material is not and should not be construed as an offer to buy or sell any security. It should not be construed as research or investment advice or a recommendation to buy, sell or hold any security or commodity. This material does not and is not intended to take into account the particular financial conditions, investment objectives or requirements of individual customers. Before acting on this material, you should consider whether it is suitable for your particular circumstances and, as necessary, seek professional advice.
Disclosure: ETFs
Any discussion or mention of an ETF is not to be construed as recommendation, promotion or solicitation. All investors should review and consider associated investment risks, charges and expenses of the investment company or fund prior to investing. Before acting on this material, you should consider whether it is suitable for your particular circumstances and, as necessary, seek professional advice.
Disclosure: Research
The availability of research providers may differ depending on your location. Much of the tools, information and services accessible through research tools are prepared and offered by independent third-party providers and not by Interactive Brokers. Information about a third-party provider provided on market research pages is NOT a recommendation of that provider by Interactive Brokers. Interactive Brokers does not make any representations or warranties concerning the services provided by the third-party providers.


Join The Conversation
If you have a general question, it may already be covered in our FAQs page. go to: IBKR Ireland FAQs or IBKR U.K. FAQs. If you have an account-specific question or concern, please reach out to Client Services: IBKR Ireland or IBKR U.K..
Visit IBKR U.K. Open an IBKR U.K. Account