


The article “The Hidden Risks of Leveraged Single-Stock ETFs” was originally published on Alpha Architect blog.
Levered ETFs may appeal to those who wish to hedge other positions, those with strong directional views, or those with so-called “lottery preferences.” – Hendrik Bessembinder
The Explosive Growth of a Risky Product
Leveraged single-stock Exchange-Traded Funds (LSS-ETFs) have captured investors’ attention with a seductive promise: amplified exposure to popular stocks without the complexity of margin trading. The first levered single stock ETFs (LSS-ETFs) were introduced in July 2022. By late 2024 the market capitalization of LSS-ETFs had grown to more than $17 billion. And there has been a surge in LSS-ETFs rollouts during the first half of 2025, with a total of more than 100 such ETFs trading as of mid-2025. These products typically offer 2x or 3x daily leverage (or inverse exposure) to stocks like Tesla, Apple, or NVIDIA. Direxion, a leader in offering these products uses this advertisement on their website. But do they deliver what investors expect?
My July 16, 2025 Substack column examined the research on the hidden costs of leveraged and inverse ETFS, demonstrating that these were products that were designed to be sold to investors, but investors should never buy them. Thanks to Hendrik Bessembinder, author of the August 2025 study, “Leveraged Single-Stock ETFs,” we can also examine the hidden risks and costs of a related product, leveraged single stock ETFs.
Bessembinder compared levered single-stock ETF returns to the benchmark defined by target leverage times the stock return. His data sample of LSS-ETFs covered the period from fund inception through June 31, 2025. As evidence of their popularity, the sample grew from six funds with a combined market capitalization of just $6.4 million on the first date to 33 funds with a combined capitalization of $17.4 billion at the end June 2025.
The following is a summary of his findings:
- For the full sample of 19,456 fund/days, the average fund return was 0.05% compared to an average underlying stock return of 0.16%. For funds with positive leverage the average daily return was 0.22%. Funds with β = 2 leverage had a mean daily return of 0.27%, those with β =1.5 leverage had a mean daily return of 0.22%, but those with β =1.75 leverage had a mean daily return of -0.05%.
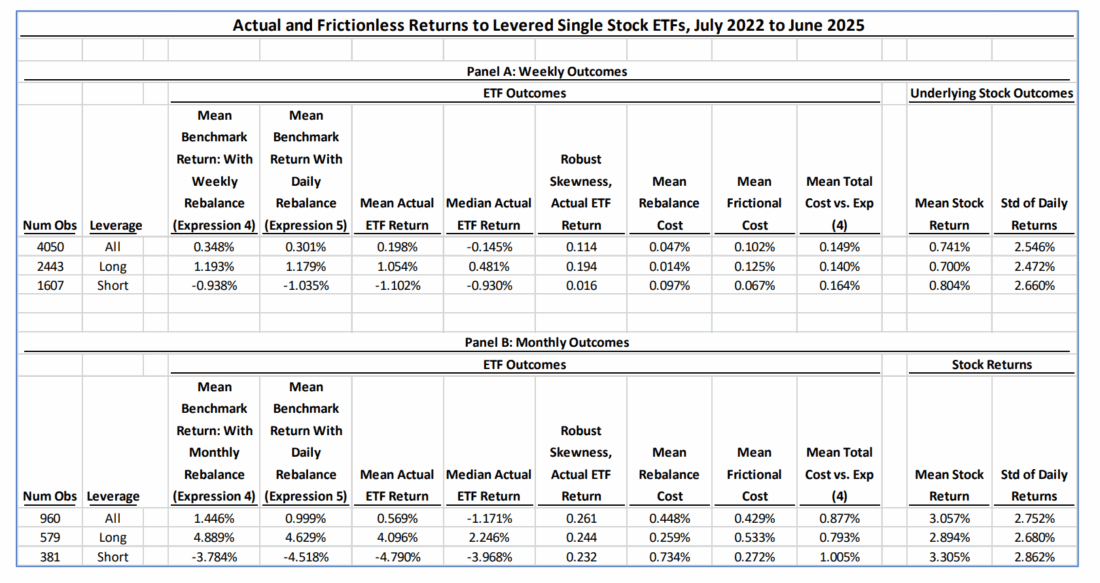
- Monthly returns to the LSS-ETFs in the sample underperformed the simple benchmark by an average of 0.88% per month, with 0.45% underperformance attributable to the effects of daily rebalancing and 0.43% attributable to frictions.
- Friction costs were larger for positive leverage (average of 0.53% per month) than for inverse leverage funds (average of 0.26% per month), while rebalancing costs were larger for negative (average of 0.73%) than for positive leverage (average of 0.27%) funds.
- Average friction costs are greater for funds that offer larger absolute exposures. For example, the average friction cost for funds with 𝛽 = 2 is 0.030% per day, compared to 0.019% per day for funds with 𝛽 = 1.5. The average friction cost for funds with 𝛽= -2 is 0.029% per day, compared to 0.010% per day for funds with 𝛽 = -1. Larger friction costs for funds with greater absolute leverage likely reflect the costs implicit in entering larger swap contracts.
The results are hypothetical results and are NOT an indicator of future results and do NOT represent returns that any investor actually attained. Indexes are unmanaged and do not reflect management or trading fees, and one cannot invest directly in an index.
The Daily Rebalancing Problem
As discussed above, friction costs are a significant problem for LSS-ETFs. Another issue results from the daily rebalancing mechanism. Leveraged ETFs reset their leverage ratio every day, creating a compounding effect that deviates significantly from simple leverage math over longer periods. This daily reset requirement means:
- Volatility Decay: When there is negative serial correlation of returns, higher volatility implies that rebalancing trades involve buying high and selling low, which erodes levered ETF returns. This was an important new finding: there is volatility decay only when there is negative serial correlation of returns.
- Path Dependency: The sequence of daily returns matters more than the overall return of the underlying stock.
- Compounding Mismatch: Monthly and longer-term returns diverge substantially from leveraged benchmarks.
Bessembinder also exploited the fact that historical daily returns are available for thousands of common stocks over five decades to study the returns that LSS-ETFs would hypothetically have delivered if they had been available to investors in the past—allowing for a much larger sample. He considered hypothetical frictionless returns measured over horizons, including daily, weekly, monthly, six-month, and annual, for hypothetical ETFs with leverage multipliers, beta (β), equal to 3, 2, 1 (unlevered, for comparison) -1, and -2.
He found:
- Mean returns to hypothetical single-stock ETFs with positive leverage would have exceeded unlevered stock returns at all horizons considered, while mean returns to inverse or negative leverage ETFs would have been negative at all horizons.
- Frictionless monthly returns to hypothetical single-stock ETFs underperform the simple benchmark by an average of 0.28% with 3x leverage and by 0.49% with -2x leverage, attributable to the effects of daily rebalancing trades.
- Reflecting the strong skewness in levered fund returns, especially at longer horizons, more than half of hypothetical levered fund returns are less than the unlevered return to the value-weighted U.S. stock market, for all return measurement horizons and leverage multipliers considered.
Importantly, Bessembinder demonstrated that while the following has not yet occurred for any leveraged ETF launched since 2022, a levered ETF can imply a target daily return less than -100%. “For example, (ignoring the relatively minor effects of daily interest) a leverage ratio of three implies that the target ETF return is less than -100% if the stock return is less than -33 1/3%.” However, he showed that it would have occurred with Apple’s stock, for any leverage of 2 or greater, on September 29, 2000 when it fell 51.9%.
Bessembinder noted:
“Of course, a target return less than -100% does not imply a return less than -100% to an actual investor who enjoys limited liability. In the absence of a contractual provision or legal ruling that creates a claim on investors’ assets other than those used to purchase the levered ETF, investor returns cannot be less than -100%. The limited liability notion for levered ETFs may rely in part on “acceleration clauses” that allow the sponsor to “call in” the product if it suffers large losses. To avoid a target return less than -100% would require underlying stock and/or swap positions be unwound quickly, even potentially in the presence of trading halts or circuit breakers. To my knowledge the ability to place a floor such that target returns do not fall below -100% has not yet been tested by a case where the specified leverage times the underlying asset daily return for any ETF was less than -100%.”
Key Investor Takeaways
The critical insight is that, if you ignore the high friction costs Bessembinder identified, leveraged ETFs function precisely as designed—they deliver leveraged exposure to daily returns, not long-term performance. Problems emerge when investors misuse these instruments for purposes they weren’t built for, particularly buy-and-hold investing or long-term wealth accumulation. Consider how Direxion, a leading provider of leveraged ETFs, describes their target market: “Now risk-hungry traders can get daily 2X bull or -1X bear exposure to heavily traded individual large cap stocks.” Notice the deliberate language—”risk-hungry traders” seeking “daily” exposure, not long-term investors building wealth. This framing should serve as a clear signal about the intended use (speculating, not investing) and audience for these complex financial instruments.
Conclusion
The analysis of US-based leveraged single-stock ETFs reveals a complex landscape where marketing promises don’t always align with real-world performance. While these products successfully achieve their daily objectives, their long-term performance can deviate significantly from investor expectations due to mathematical realities that result from daily rebalancing effects: compounding, volatility decay, and frictions (implementation costs).
The key insights from this research are clear: these products are not suitable for buy-and-hold strategies nor for investors who don’t fully understand their mechanics. The research serves as a crucial reminder that in investing complexity can come with hidden costs and unexpected risks.
The financial industry’s continued innovation in ETF products provides investors with more tools than ever before, but as this research demonstrates, understanding the true costs and behaviors of these tools is essential for making informed investment decisions.
Larry Swedroe is the author or co-author of 18 books on investing, including his latest Enrich Your Future. He is also a consultant to RIAs as an educator on investment strategies.
Disclosure: Alpha Architect
The views and opinions expressed herein are those of the author and do not necessarily reflect the views of Alpha Architect, its affiliates or its employees. Our full disclosures are available here. Definitions of common statistics used in our analysis are available here (towards the bottom).
This site provides NO information on our value ETFs or our momentum ETFs. Please refer to this site.
Disclosure: Interactive Brokers Third Party
Information posted on IBKR Campus that is provided by third-parties does NOT constitute a recommendation that you should contract for the services of that third party. Third-party participants who contribute to IBKR Campus are independent of Interactive Brokers and Interactive Brokers does not make any representations or warranties concerning the services offered, their past or future performance, or the accuracy of the information provided by the third party. Past performance is no guarantee of future results.
This material is from Alpha Architect and is being posted with its permission. The views expressed in this material are solely those of the author and/or Alpha Architect and Interactive Brokers is not endorsing or recommending any investment or trading discussed in the material. This material is not and should not be construed as an offer to buy or sell any security. It should not be construed as research or investment advice or a recommendation to buy, sell or hold any security or commodity. This material does not and is not intended to take into account the particular financial conditions, investment objectives or requirements of individual customers. Before acting on this material, you should consider whether it is suitable for your particular circumstances and, as necessary, seek professional advice.
Disclosure: ETFs
Any discussion or mention of an ETF is not to be construed as recommendation, promotion or solicitation. All investors should review and consider associated investment risks, charges and expenses of the investment company or fund prior to investing. Before acting on this material, you should consider whether it is suitable for your particular circumstances and, as necessary, seek professional advice.
Join The Conversation
If you have a general question, it may already be covered in our FAQs page. go to: IBKR Ireland FAQs or IBKR U.K. FAQs. If you have an account-specific question or concern, please reach out to Client Services: IBKR Ireland or IBKR U.K..
Visit IBKR U.K. Open an IBKR U.K. Account