










1/ Crude Oil Finally Demonstrates Bullish Momentum
2/ Fibonacci Framework Signals Breakout for OXY
3/ JPM Pullback Unlocks Potential Downside Targets
Investopedia is partnering with CMT Association on this newsletter. The contents of this newsletter are for informational and educational purposes only, however, and do not constitute investing advice. The guest authors, which may sell research to investors, and may trade or hold positions in securities mentioned herein do not represent the views of CMT Association or Investopedia. Please consult a financial advisor for investment recommendations and services.
1/
Crude Oil Finally Demonstrates Bullish Momentum
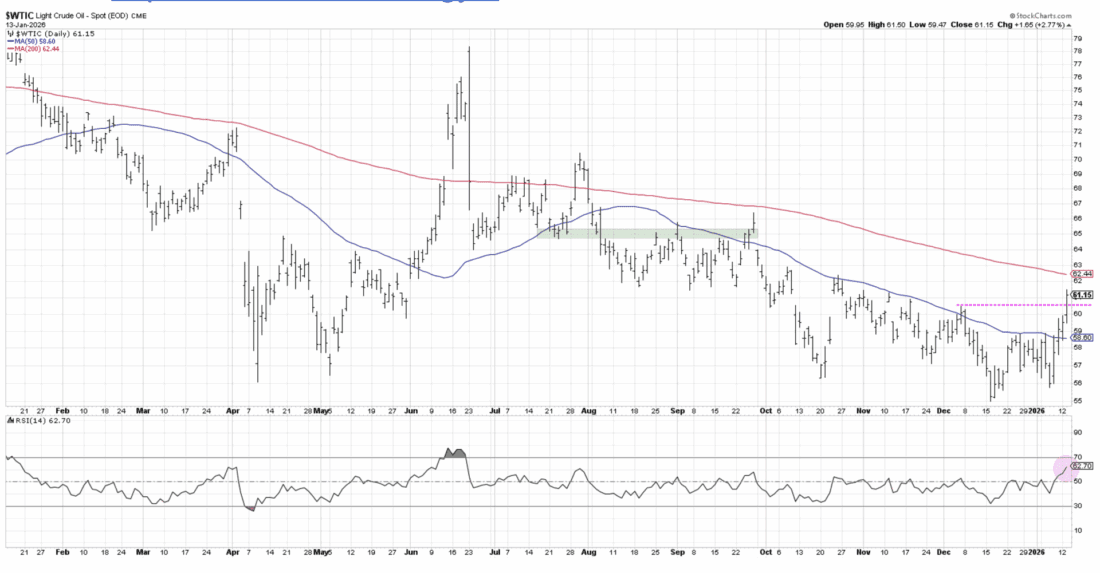
For most energy stocks, upside is usually limited unless crude oil is showing strength. After a strong upward push on Tuesday, the chart of crude oil has now cleared a significant resistance level as it approaches the vital 200-day moving average.
Past performance is not indicative of future returns.
After rallying into the upper 70s in June 2025, crude oil futures broke below the 200-day moving average as a new downtrend emerged. Over the last three months, crude oil has not been able to regain the 50-day moving average, speaking to the consistency of this distribution phase.
The RSI has been consistently below 60, confirming the bearish momentum structure as crude oil eventually hit a low around $55 in mid-December. This week’s rally has pushed the RSI above 60 for the first time since June 2025. If crude oil can hold Tuesday’s breakout to a new swing high, this could lead to further upside above the 200-day moving average as a new uptrend phase begins.
2/
Fibonacci Framework Signals Breakout for OXY
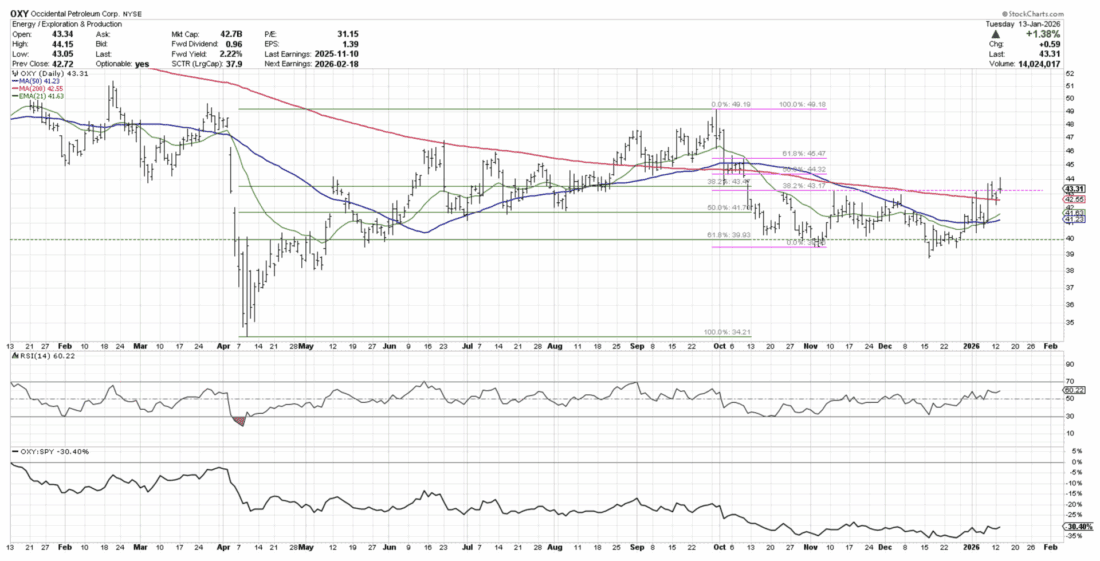
While some leading energy names like Halliburton (HAL) have been in established uptrends in recent months, I’m more intrigued by stocks in the sector that are just starting to emerge from a basing pattern. With Occidental Petroleum (OXY) driving above $44 on Tuesday, this could signal a breakout above a confluence of resistance.
Past performance is not indicative of future returns.
After reaching up to $49 in September 2025, OXY dropped down to a 61.8% retracement level using the April 2025 low as a starting point. After a new swing low around $39.50 in early November, the price popped back up to a 38.2% retracement level based on the October selloff.
This sort of “Fibonacci framework” can help us analyze the relationship between different price swings, and also put short-term moves into proper long-term context. Over the last three weeks, OXY has pushed above Fibonacci resistance as well as the 200-day moving average. If this diversified energy name can continue above the $44 level, that would represent a new breakout phase after a three-month sideways period.
3/
JPM Pullback Unlocks Potential Downside Targets
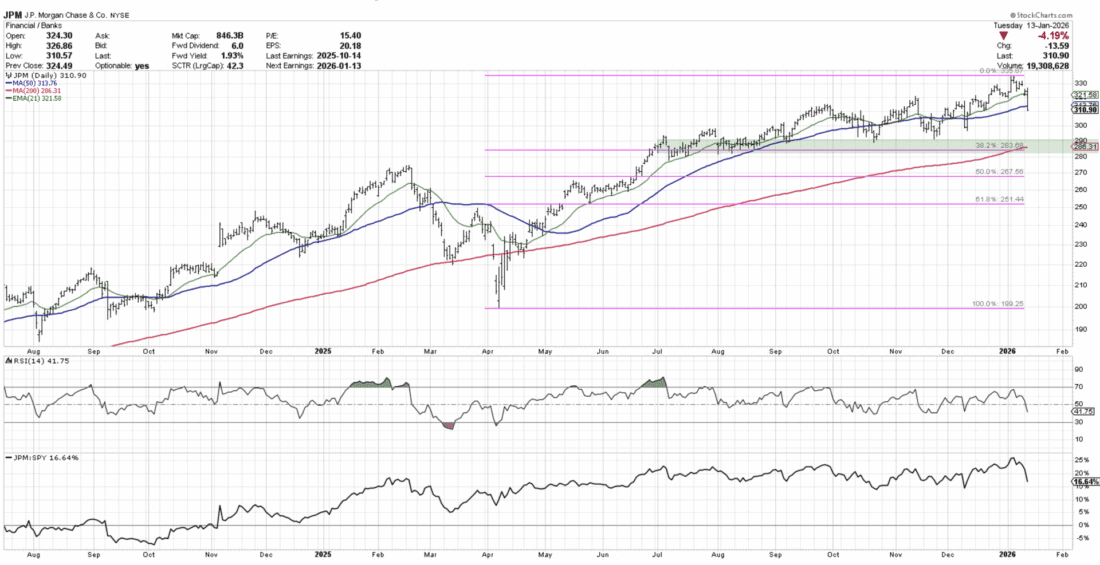
Shares of J.P. Morgan Chase (JPM) dropped Tuesday after a disappointing earnings report. While the long-term trend appears strong, with a continued pattern of higher highs and higher lows, the recent pullback has brought the uptrend phase into question.
Past performance is not indicative of future returns.
Tuesday’s post-earnings drop sent JPM back below the 50-day moving average, which often serves as a short-term trend barometer within an uptrend phase. I’m looking for potential support in the $280-290 range based on the 200-day moving average and Fibonacci support using the April 2025 low and last week’s all-time high.
The RSI has dropped down to the 40 level, similar to the October and November pullbacks. If JPM can hold $280, and the RSI can remain above this crucial 40 level, then bulls can remain confident in the sustainability of the long-term uptrend phase. However, a break below $280 on weaker momentum readings could finally confirm an end to one of the more impressive 2025 runs outside of the growth sectors.
—
Originally posted 14th January 2026
Disclosure: Investopedia
Investopedia.com: The comments, opinions and analyses expressed herein are for informational purposes only and should not be considered individual investment advice or recommendations to invest in any security or to adopt any investment strategy. While we believe the information provided herein is reliable, we do not warrant its accuracy or completeness. The views and strategies described on our content may not be suitable for all investors. Because market and economic conditions are subject to rapid change, all comments, opinions and analyses contained within our content are rendered as of the date of the posting and may change without notice. The material is not intended as a complete analysis of every material fact regarding any country, region, market, industry, investment or strategy. This information is intended for US residents only.
Disclosure: Interactive Brokers Third Party
Information posted on IBKR Campus that is provided by third-parties does NOT constitute a recommendation that you should contract for the services of that third party. Third-party participants who contribute to IBKR Campus are independent of Interactive Brokers and Interactive Brokers does not make any representations or warranties concerning the services offered, their past or future performance, or the accuracy of the information provided by the third party. Past performance is no guarantee of future results.
This material is from Investopedia and is being posted with its permission. The views expressed in this material are solely those of the author and/or Investopedia and Interactive Brokers is not endorsing or recommending any investment or trading discussed in the material. This material is not and should not be construed as an offer to buy or sell any security. It should not be construed as research or investment advice or a recommendation to buy, sell or hold any security or commodity. This material does not and is not intended to take into account the particular financial conditions, investment objectives or requirements of individual customers. Before acting on this material, you should consider whether it is suitable for your particular circumstances and, as necessary, seek professional advice.
Disclosure: Futures Trading
Futures are not suitable for all investors. The amount you may lose may be greater than your initial investment. Before trading futures, please read the CFTC Risk Disclosure. A copy and additional information are available at the Warnings and Disclosures section of your local Interactive Brokers website.
Disclosure: ETFs
Any discussion or mention of an ETF is not to be construed as recommendation, promotion or solicitation. All investors should review and consider associated investment risks, charges and expenses of the investment company or fund prior to investing. Before acting on this material, you should consider whether it is suitable for your particular circumstances and, as necessary, seek professional advice.




Join The Conversation
If you have a general question, it may already be covered in our FAQs page. go to: IBKR Ireland FAQs or IBKR U.K. FAQs. If you have an account-specific question or concern, please reach out to Client Services: IBKR Ireland or IBKR U.K..
Visit IBKR U.K. Open an IBKR U.K. Account