


Originally Posted 29 September 2025 – Platinum Soars 50% as Investors Diversify Portfolios, Hedge Inflation
After spending nearly a decade range-trading between $600 and $1,250 per troy ounce, platinum prices have risen nearly 50% so far in 2025. Platinum’s advance isn’t happening in isolation, but rather in tandem with gold having its best year since 1979 and the price of silver approaching a record high (Figure 1).
Figure 1: Platinum prices are up nearly 50% in 2025 as gold and silver head towards records
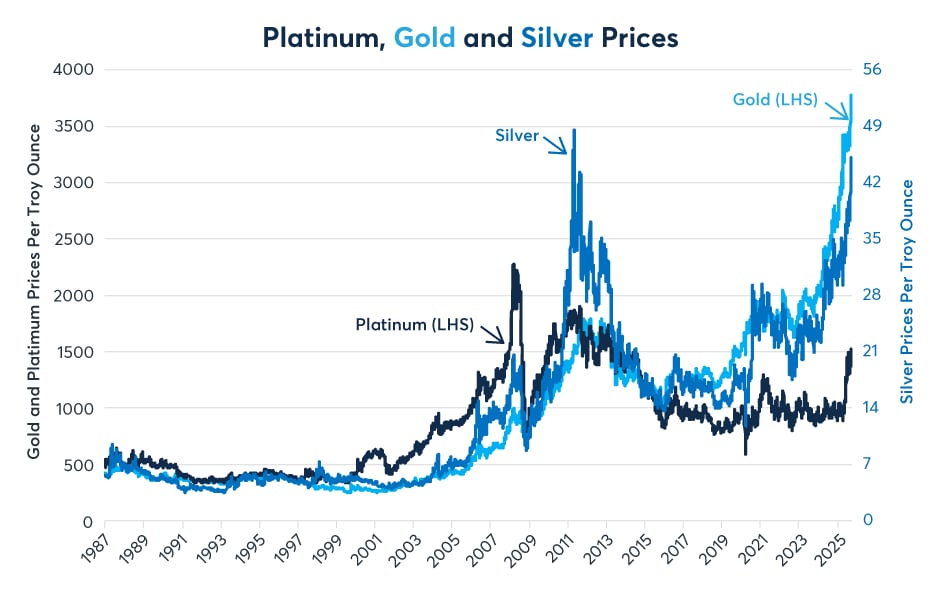
Past performance is not indicative of future results
The Macroeconomic Context of the Platinum Rally
What the precious metals have in common is a global concern about holding central bank-issued fiat currencies amid above-target and often rising core inflation, falling central bank rates and exceptionally large budget deficits in many of the world’s largest economies.
Most central banks target 2% inflation. Yet, outside of China and Switzerland, nearly every major economy is seeing core inflation running above target. Moreover, core inflation rates have stopped falling nearly everywhere, and in many countries, including the U.S., U.K. and Japan, have begun to rise again (Figure 2).
Figure 2: Core inflation is above target and rising in much of the world
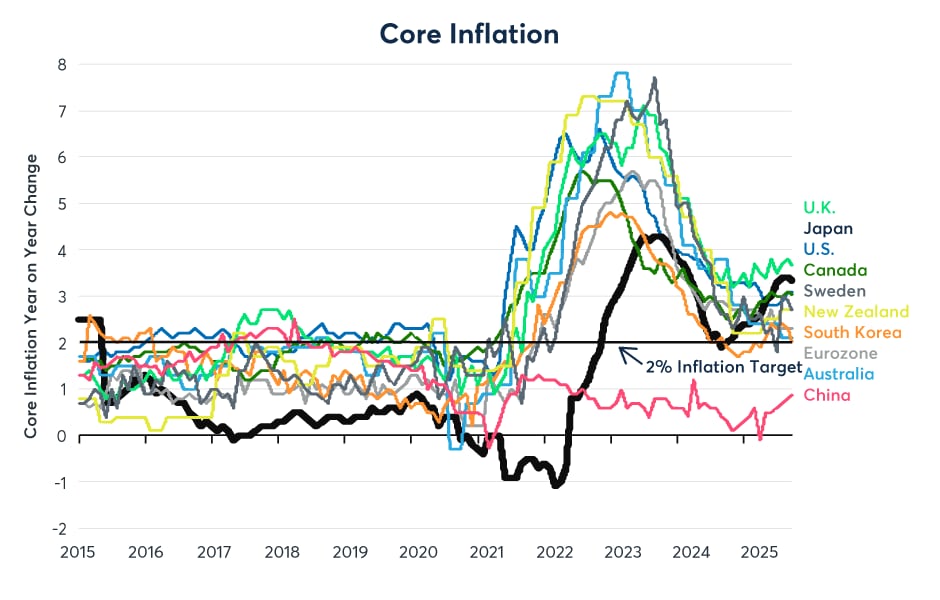
Past performance is not indicative of future results
Despite generally above-target and rising core inflation, nearly every central bank on the planet has been lowering interest rates (Figure 3). The only exceptions are Brazil and Japan, but in Japan’s case the Bank of Japan’s policy rate is 0.5% while core inflation is rising towards 4%, giving the country a -3% real rate of interest.
Figure 3: Despite above-target inflation, most central banks are easing policy
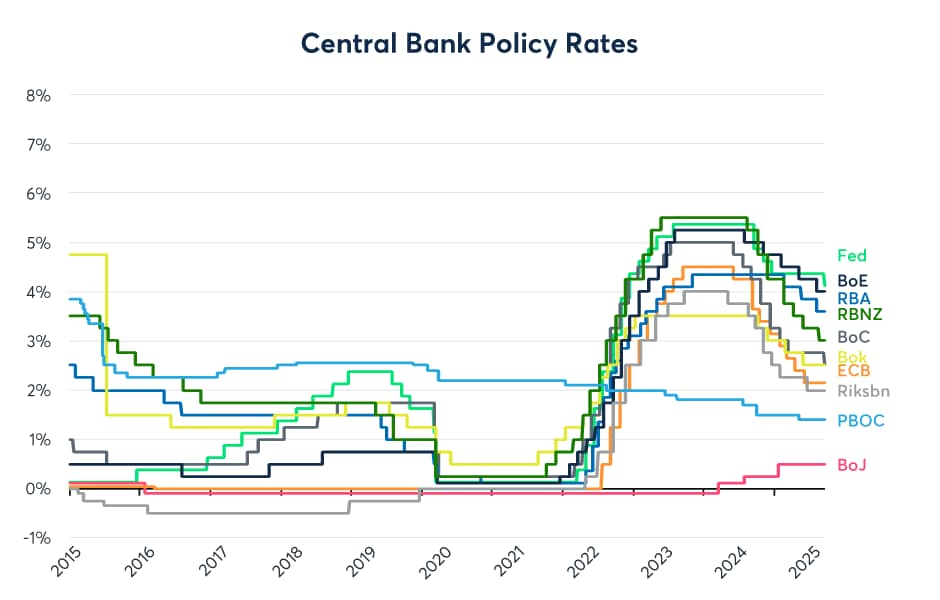
Past performance is not indicative of future results
The fiscal situation isn’t much better. China is running an 8% of GDP budget deficit after tax revenues fell from 29% to 21% of GDP. Moreover, public debt has crossed 90% of GDP for the first time and the government projects budget deficits of 8-9% of GDP from now through at least 2030.
The U.S. fiscal picture isn’t much different. In the U.S., public debt comes to 114% of GDP, and the budget deficit, despite a sharp rise in tariff revenue, remains at 6.3% of GDP. Across the Atlantic, the U.K. and France are running budget deficits of 4.5% and 5.5% of GDP, respectively. Both governments are struggling to find additional tax revenues or make the spending cuts to rein in the deficits.
Japan’s deficit has fallen to 3% of GDP, which is relatively narrow by Japanese standards, but total public debt is over 200% of GDP and threatens to rise further as rising interest rates boost Japan’s cost of funding. Finally, Brazil, whose central bank has been vigilant on inflation, is running a 7.1% of GDP budget deficit.
In this context, there appears to be a strong preference on the part of investors to buy assets that central banks can’t print and among those assets are precious metals like gold, silver and platinum. That said, any reversal by central banks towards hiking rates can pose a risk to the rally.
Why Has Platinum Underperformed Gold and Silver and Is It a Bargain?
Platinum prices are having their biggest rally since 2009-2011 and have, at times, outperformed gold and silver in 2025. That said, if one looks at the platinum/gold and platinum/silver price ratios, platinum prices have underperformed gold prices since 2011 and silver prices since 2003 (Figure 4). These price ratios measure how many troy ounces of gold or silver a troy ounce of platinum could purchase.
Figure 4: Platinum has underperformed gold and silver for decades
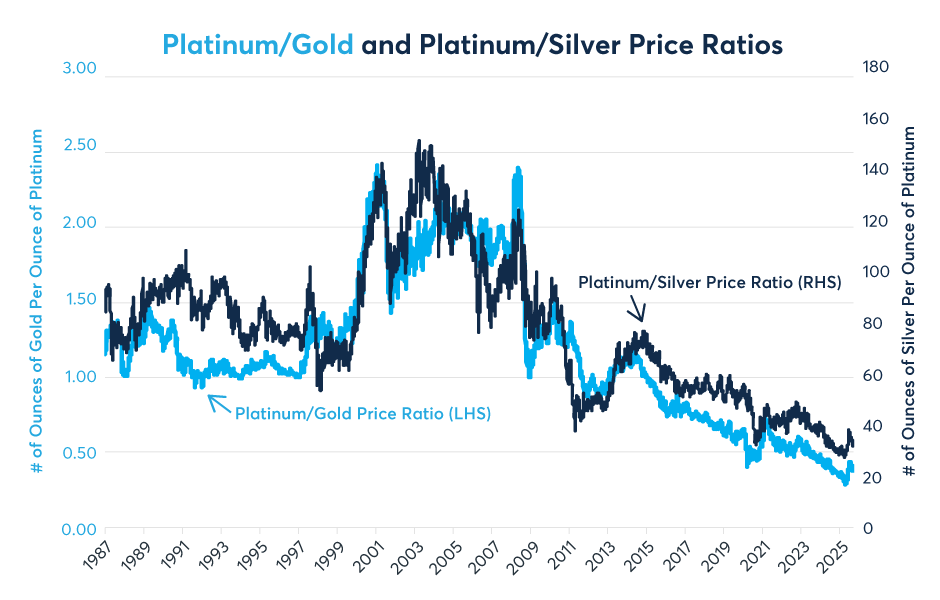
Past performance is not indicative of future results
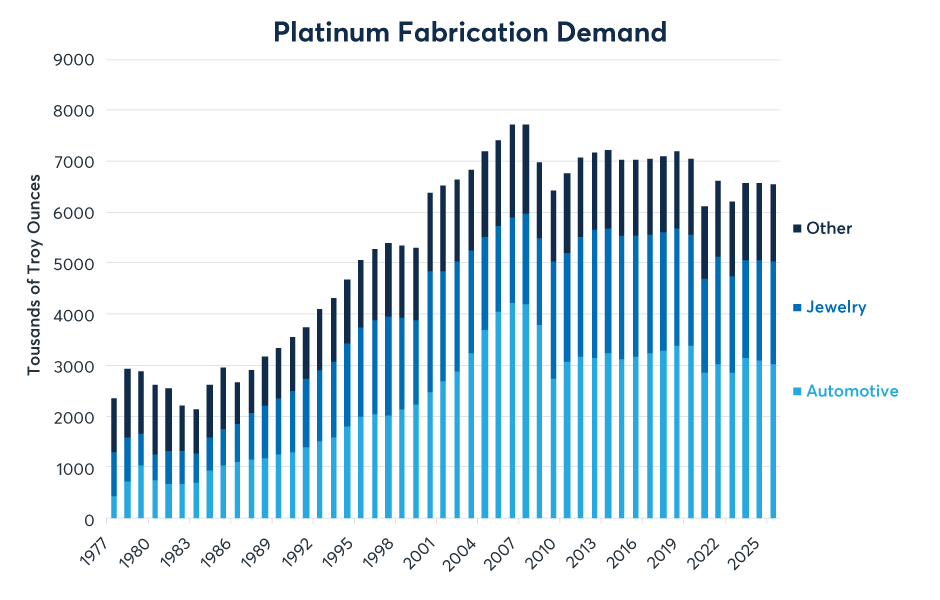
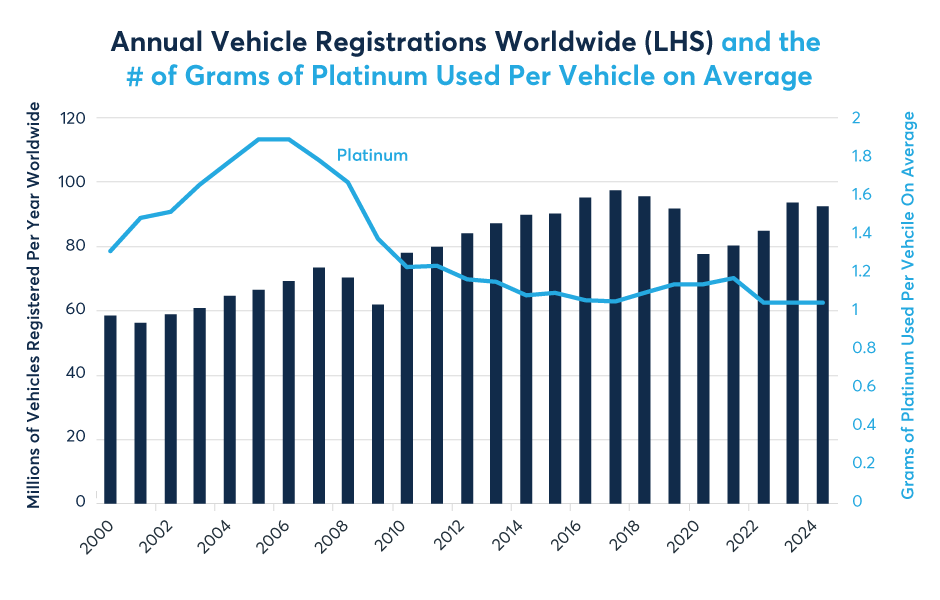
The reason why platinum has underperformed gold and silver boils down to platinum’s dependence on the automotive industry and, specifically, its use in catalytic converters in diesel engines. Automotive use of platinum peaked in 2006 and 2007 and has generally fallen or gone flat since. Meanwhile, there has been little pick up in demand for platinum jewelry or other uses (Figure 5). In fact, the amount of platinum used in the average vehicle has fallen as diesel engines have lost market share to both gasoline-powered cars and EVs (Figure 6).
Figure 5: Automotive demand accounts for most of platinum’s use
Past performance is not indicative of future results
Figure 6: The amount of platinum used in the average vehicle has fallen
Past performance is not indicative of future results
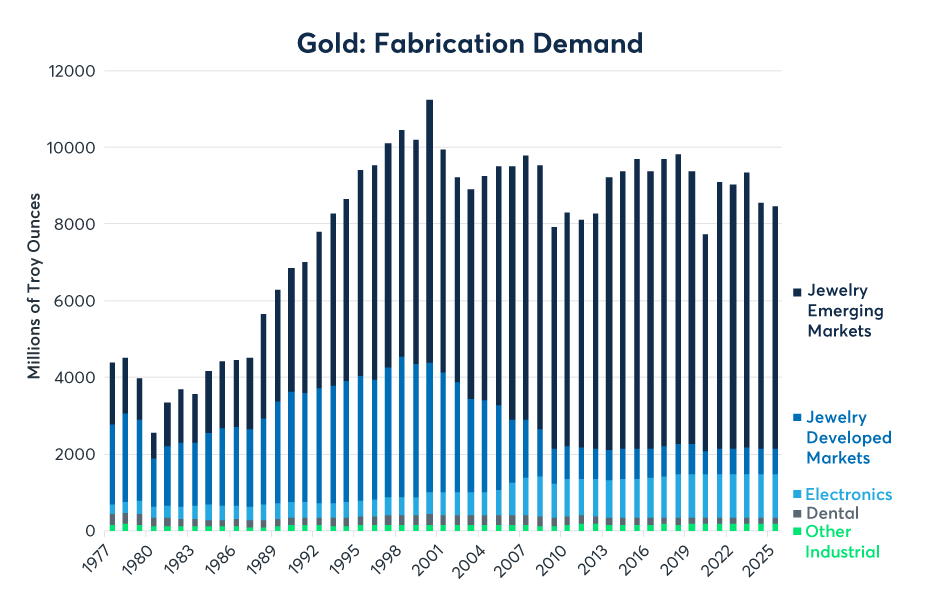
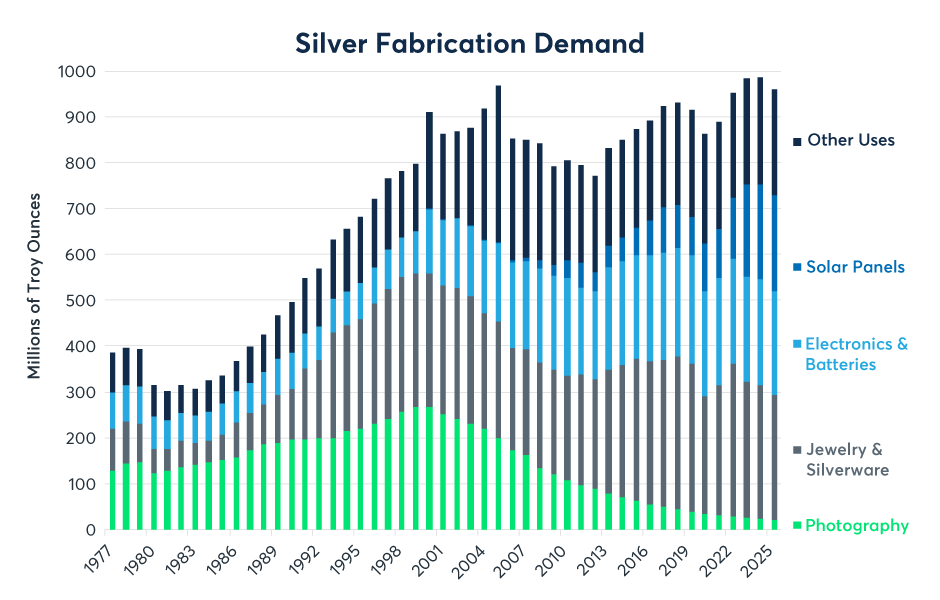
By contrast, gold is a more purely precious metal in that it is used mainly for investment purposes and has few industrial uses outside of electronics, which uses only about 5% of annual gold mining output (Figure 7). Since 2000, silver has lost its main use of developing photographs but has found a new purpose in solar panels and batteries (Figure 8).
Figure 7: Gold is used mainly for investment purposes, including jewelry
Past performance is not indicative of future results
Figure 8: Silver lost usage in photography but is gaining application in solar panels
Past performance is not indicative of future results
That said, with gold trading at record highs and silver prices approaching a new record, bargain-hunting investors looking to hedge against the potential inflationary consequences of large budget deficits and falling interest rates appear to be looking at platinum for its diversification potential. The good news for platinum is that its use in the automotive industry seems to have stabilized in recent years. While diesel cars have fallen out of favor, most trucks still run on diesel engines. Longer term, platinum demand could receive a boost from hydrogen fuel cells, which use it as a component.
Platinum Supply Dynamics
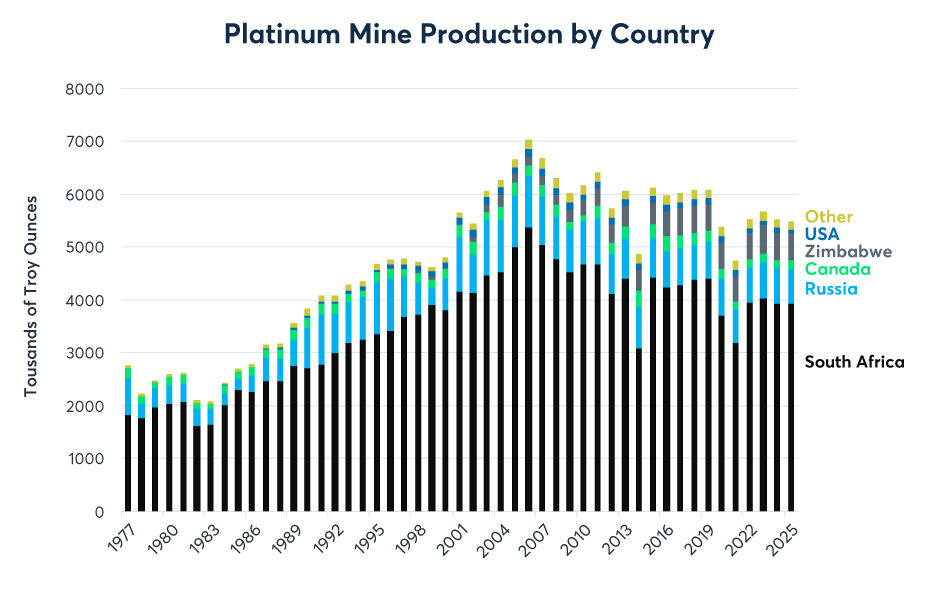
Platinum’s limited and concentrated supply also makes platinum interesting from an investment perspective. Commodities research firm CPM Group estimates that the world will produce only 5.5 million troy ounces of platinum in 2025. This amounts to only about 5-6% of the estimated mining output for gold, and less than 0.8% of the estimated mining output for silver. Moreover, platinum’s mining supply is highly concentrated in South Africa, which will likely produce about 3.9 million ounces this year. Most of the remainder of the platinum supply comes from Russia and Zimbabwe, with Canada, the U.S. and other countries producing only small amounts (Figure 9).
Figure 9: Platinum mining production is small and concentrated
Past performance is not indicative of future results
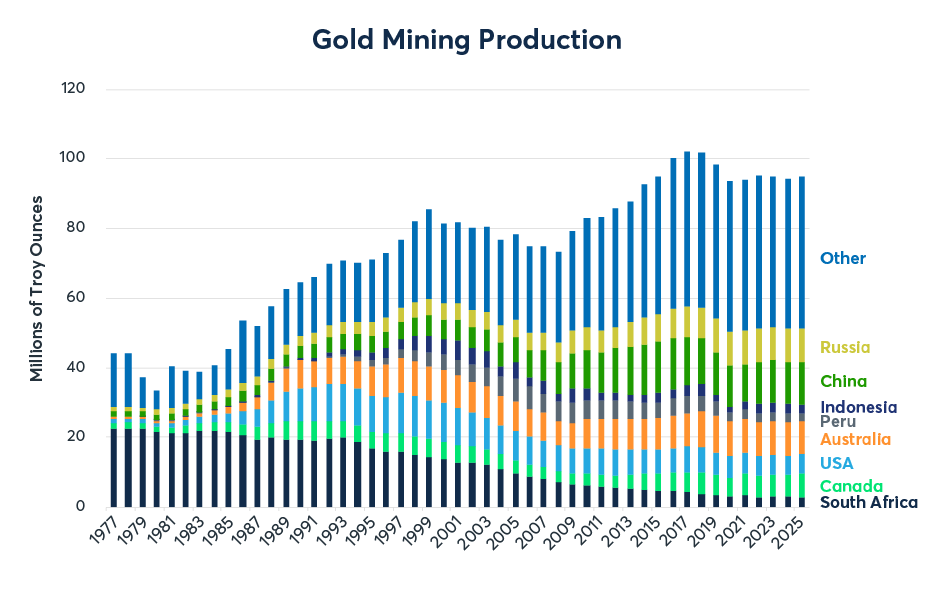
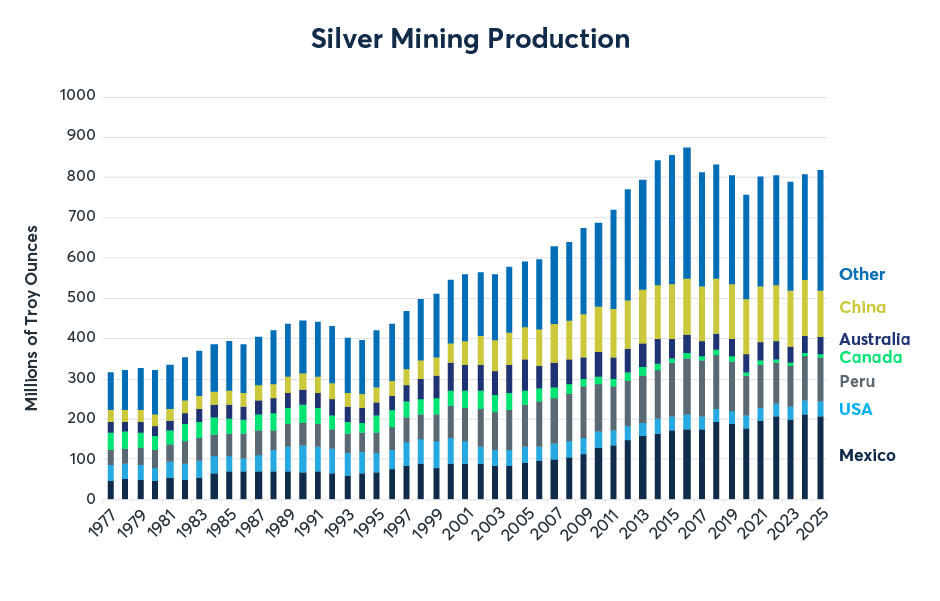
Platinum’s small and concentrated supply contrasts sharply with the much larger and more diversified supply bases for gold and silver (Figures 10 and 11).
Figure 10: Gold mining output is nearly 20x greater than platinum and is geographically diversified
Past performance is not indicative of future results
Figure 11: Silver mining output is 145x platinum’s and is also diversified
Past performance is not indicative of future results
Prior to 2025, platinum’s small and declining supply was not enough to sustain price rallies mainly due to declining use in the automotive sector. That said, platinum is historically inexpensive relative to gold and silver and as its use in the automotive sector appears to stabilize, investors may take notice of how thinly concentrated its supply-base really is.
Disclosure: CME Group
© [2023] CME Group Inc. All rights reserved. This information is reproduced by permission of CME Group Inc. and its affiliates under license. CME Group Inc. and its affiliates accept no liability or responsibility for the information contained herein, including but not limited to the currency, accuracy and/or completeness of this information, and delays, interruptions, errors or omissions. This information is an unofficial copy and may not reflect the official and accurate version. For the definitive and up-to-date version of any of this information, please see cmegroup.com.
Disclosure: Interactive Brokers Third Party
Information posted on IBKR Campus that is provided by third-parties does NOT constitute a recommendation that you should contract for the services of that third party. Third-party participants who contribute to IBKR Campus are independent of Interactive Brokers and Interactive Brokers does not make any representations or warranties concerning the services offered, their past or future performance, or the accuracy of the information provided by the third party. Past performance is no guarantee of future results.
This material is from CME Group and is being posted with its permission. The views expressed in this material are solely those of the author and/or CME Group and Interactive Brokers is not endorsing or recommending any investment or trading discussed in the material. This material is not and should not be construed as an offer to buy or sell any security. It should not be construed as research or investment advice or a recommendation to buy, sell or hold any security or commodity. This material does not and is not intended to take into account the particular financial conditions, investment objectives or requirements of individual customers. Before acting on this material, you should consider whether it is suitable for your particular circumstances and, as necessary, seek professional advice.


Join The Conversation
If you have a general question, it may already be covered in our FAQs page. go to: IBKR Ireland FAQs or IBKR U.K. FAQs. If you have an account-specific question or concern, please reach out to Client Services: IBKR Ireland or IBKR U.K..
Visit IBKR U.K. Open an IBKR U.K. Account