


The S&P 500 and the other major equity indexes are at or near record highs despite all of 2025’s uncertainties.1 And that performance has concerns about stocks being overvalued rising. On the surface, those concerns seem understandable, but a closer look at the numbers suggests a different story—that the S&P 500 may be fairly valued.
We don’t have to look too far back to find support for higher valuations. In June 2023, with forward price-to-earnings (PE) multiple at 20 times, we argued that equity valuations could easily move above that level in a piece titled “The Coiled Equity Spring”.2 Pessimistic investor sentiment, high cash levels, and a Federal Reserve poised to stop the hiking cycle seemed likely to propel valuations higher. By the end of 2023, expanding profit margins seemed like the next catalyst to higher valuations with companies running at near-record profitability quarter after quarter. Simply looking at the relationship between profit margins and valuations suggested that the S&P 500 could be reasonably priced with multiples in the mid-20s.3 And here we are.
For many investors, those multiples likely felt expensive, with the average PE since 2000 being 18 times.4 But multiples are not range bound over time, requiring investors to pay higher premiums as companies get more efficient at generating cash. If current profit margins prove sustainable, these seemingly elevated valuations may prove the new normal. Investors should, however, constantly evaluate market pricing and valuations in attempt to identify potential opportunities and risks.
Key Takeaways
- Investors seem increasingly concerned about valuations, but consensus expectations and long-term economic growth may indicate that current valuations are fair.
- Valuations can remain elevated for extended periods, so simply counting on a reversion to trend may not be the best tactic.
- Secular changes are likely helping support economic resilience and market valuations, so investors may want to consider themes tied to automation technologies, including Infrastructure Development, Defense Technology, and Cybersecurity.
A Market Menu at Reasonable Prices
Cash is king, as the saying goes, and the price of an asset is whatever someone will pay for it. Value is largely determined by assessing the fundamentals and pricing of comparable assets. Another useful tool for value is a discounted cash flow analysis, which is usually broken into the value over a specific forecast period and the terminal or continuing value.5
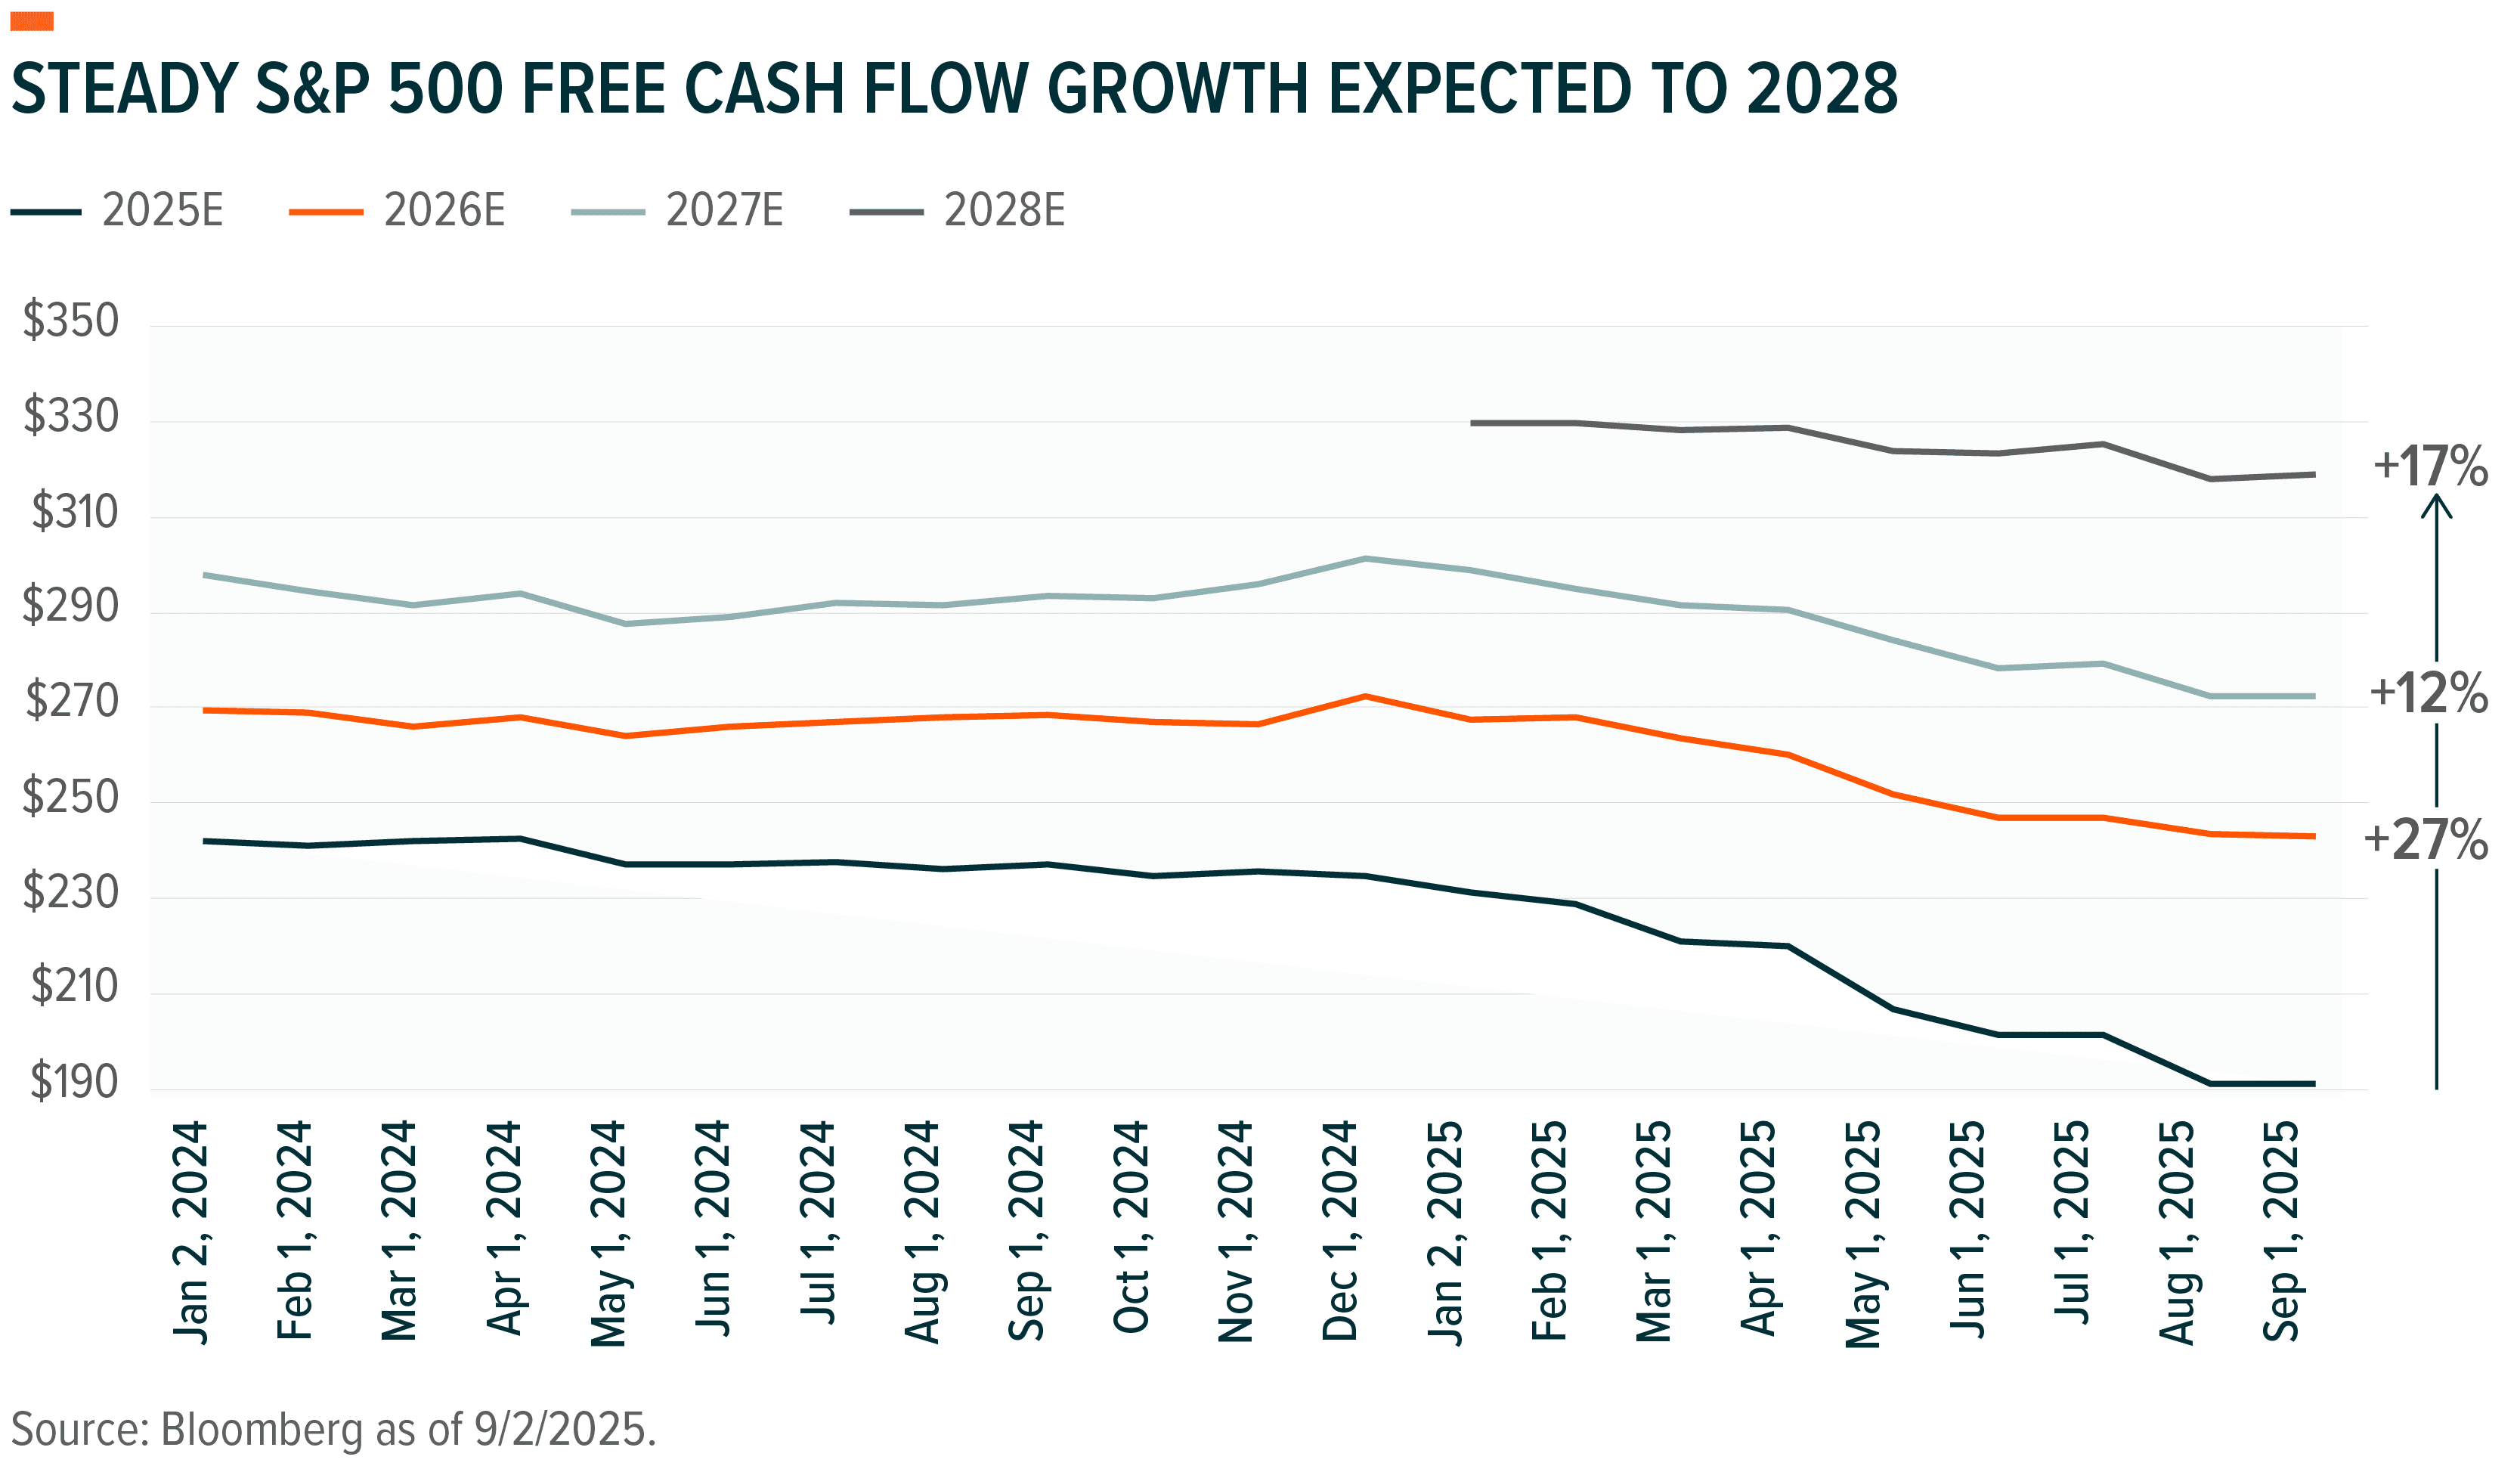
Consensus forecasts call for relatively strong cash flow growth for the S&P 500 over the next four years.6 Expectations for 2025 have been revised down modestly, largely reflecting higher-than-expected capital expenditure related to integrating new technologies such as data center and robotics—investments that should help drive future profitability. Forecasts for 2026 call for a jump in cash before it settles into mid-double-digit annual growth. This rate would exceed average cash flow growth of around 7% annually, though since 2000 it has been running above 10%.7
Past performance is not indicative of future results.
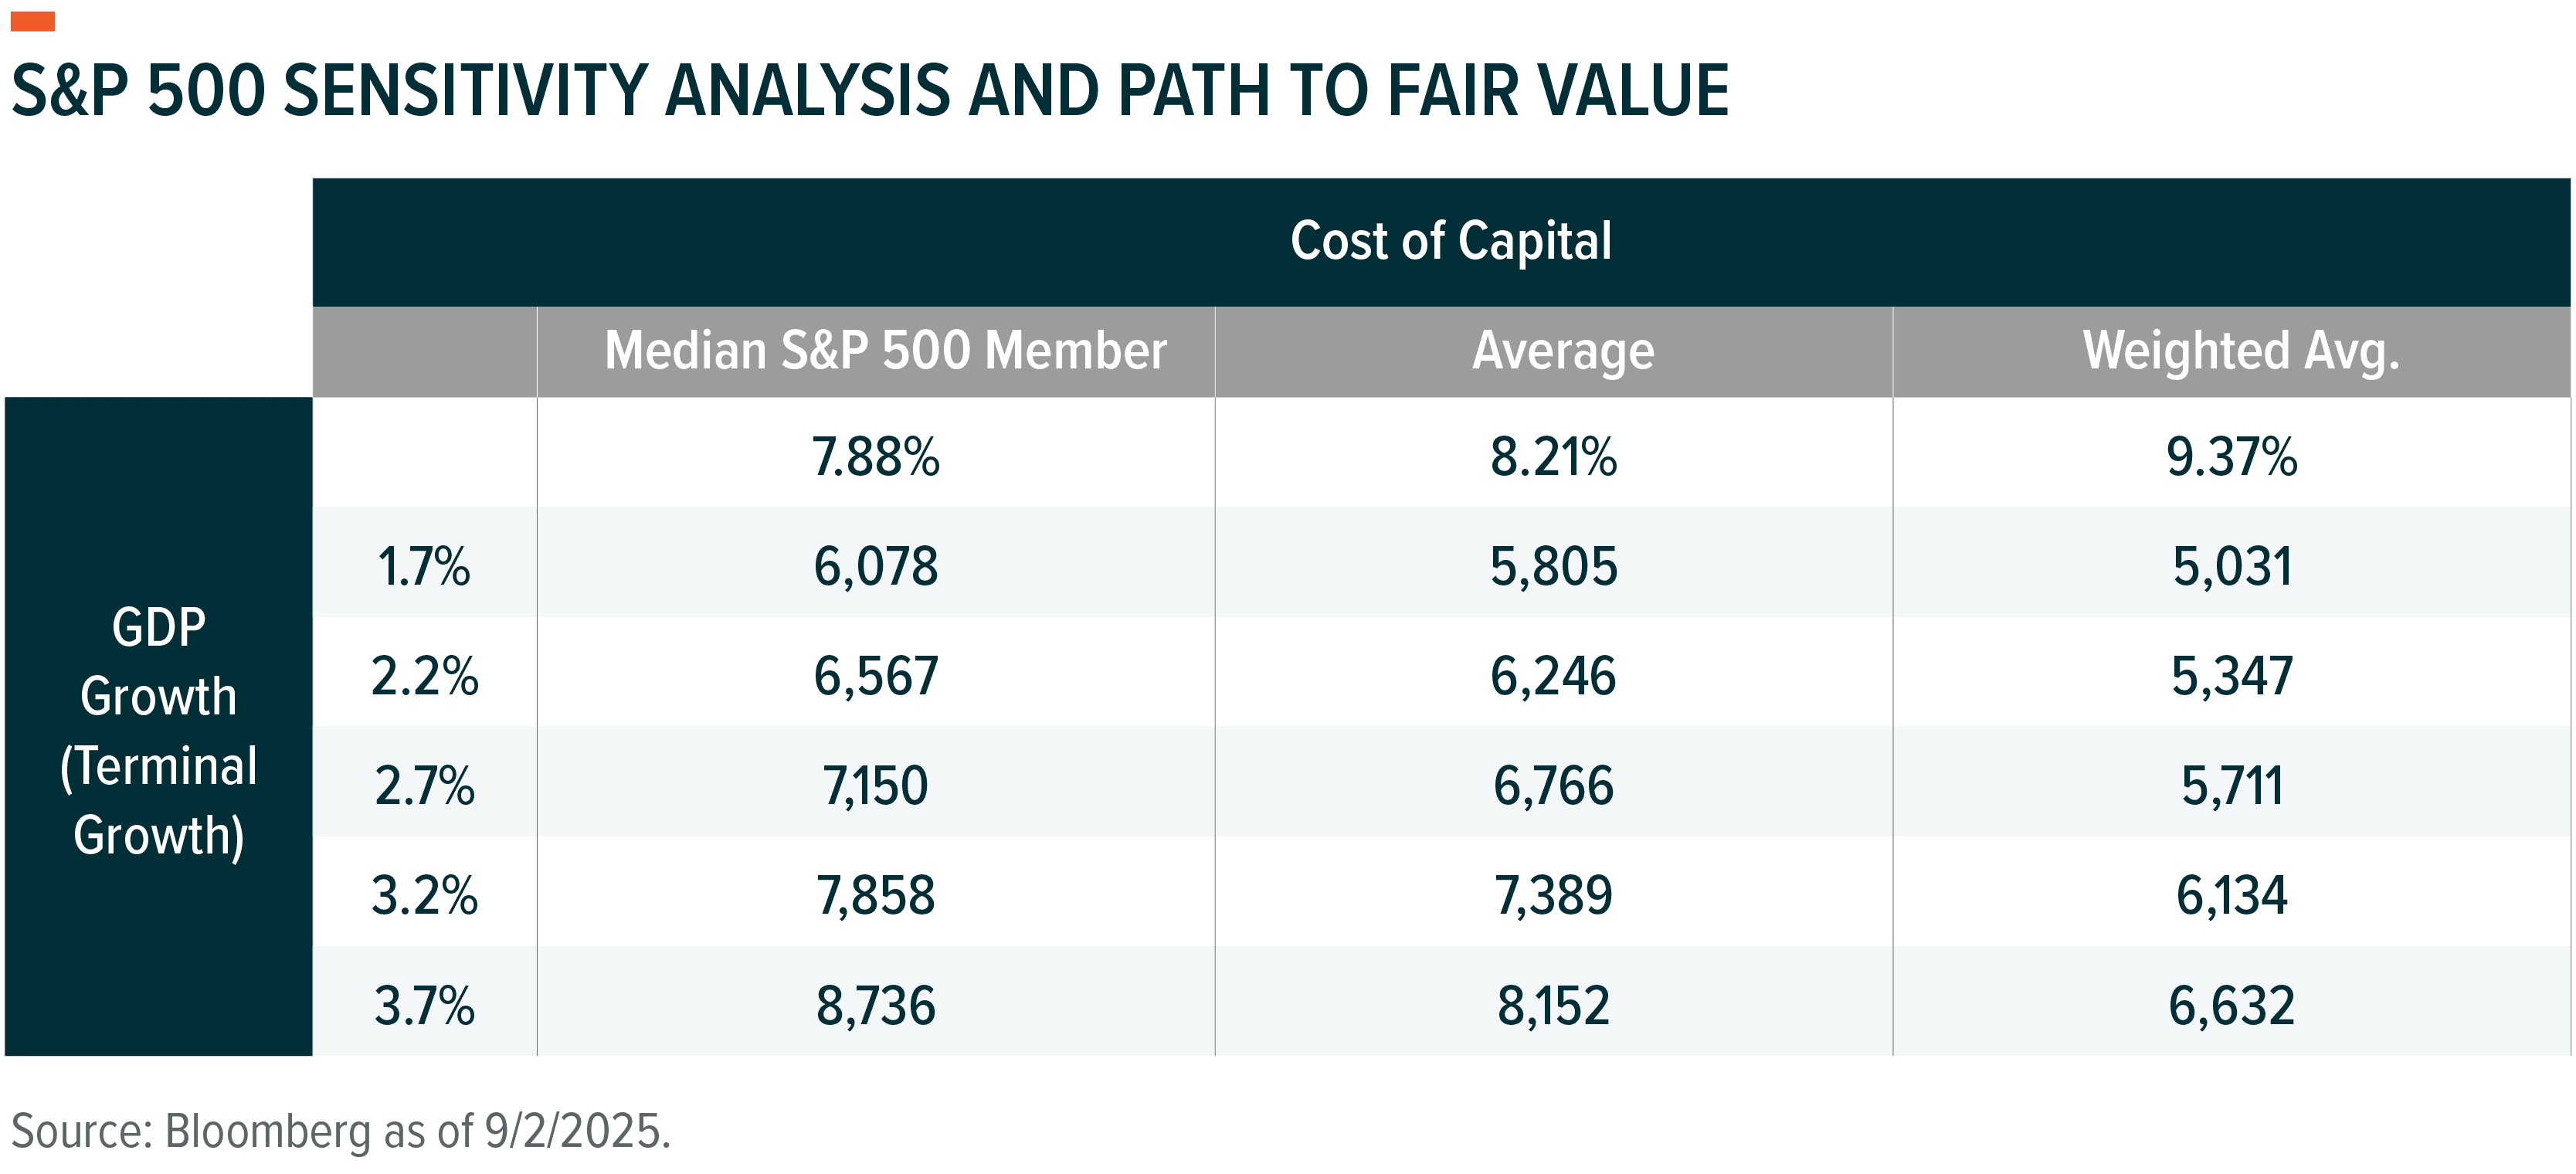
The question is whether current pricing is reasonable based on cash flow projections and the cost of capital. Finding the answer involves estimating the terminal multiple, which boils down to a single missing variable in the discounted cash flow analysis: long-term cash flow growth.8 Historically, that number should converge towards GDP growth because a broad basket of assets should mirror performance of the wider economy. The current cost of capital based on the weighted average of the constituent members is a little high at around 9.4%, but it could start trending down modestly as the interest-rate-cutting cycle resumes.9
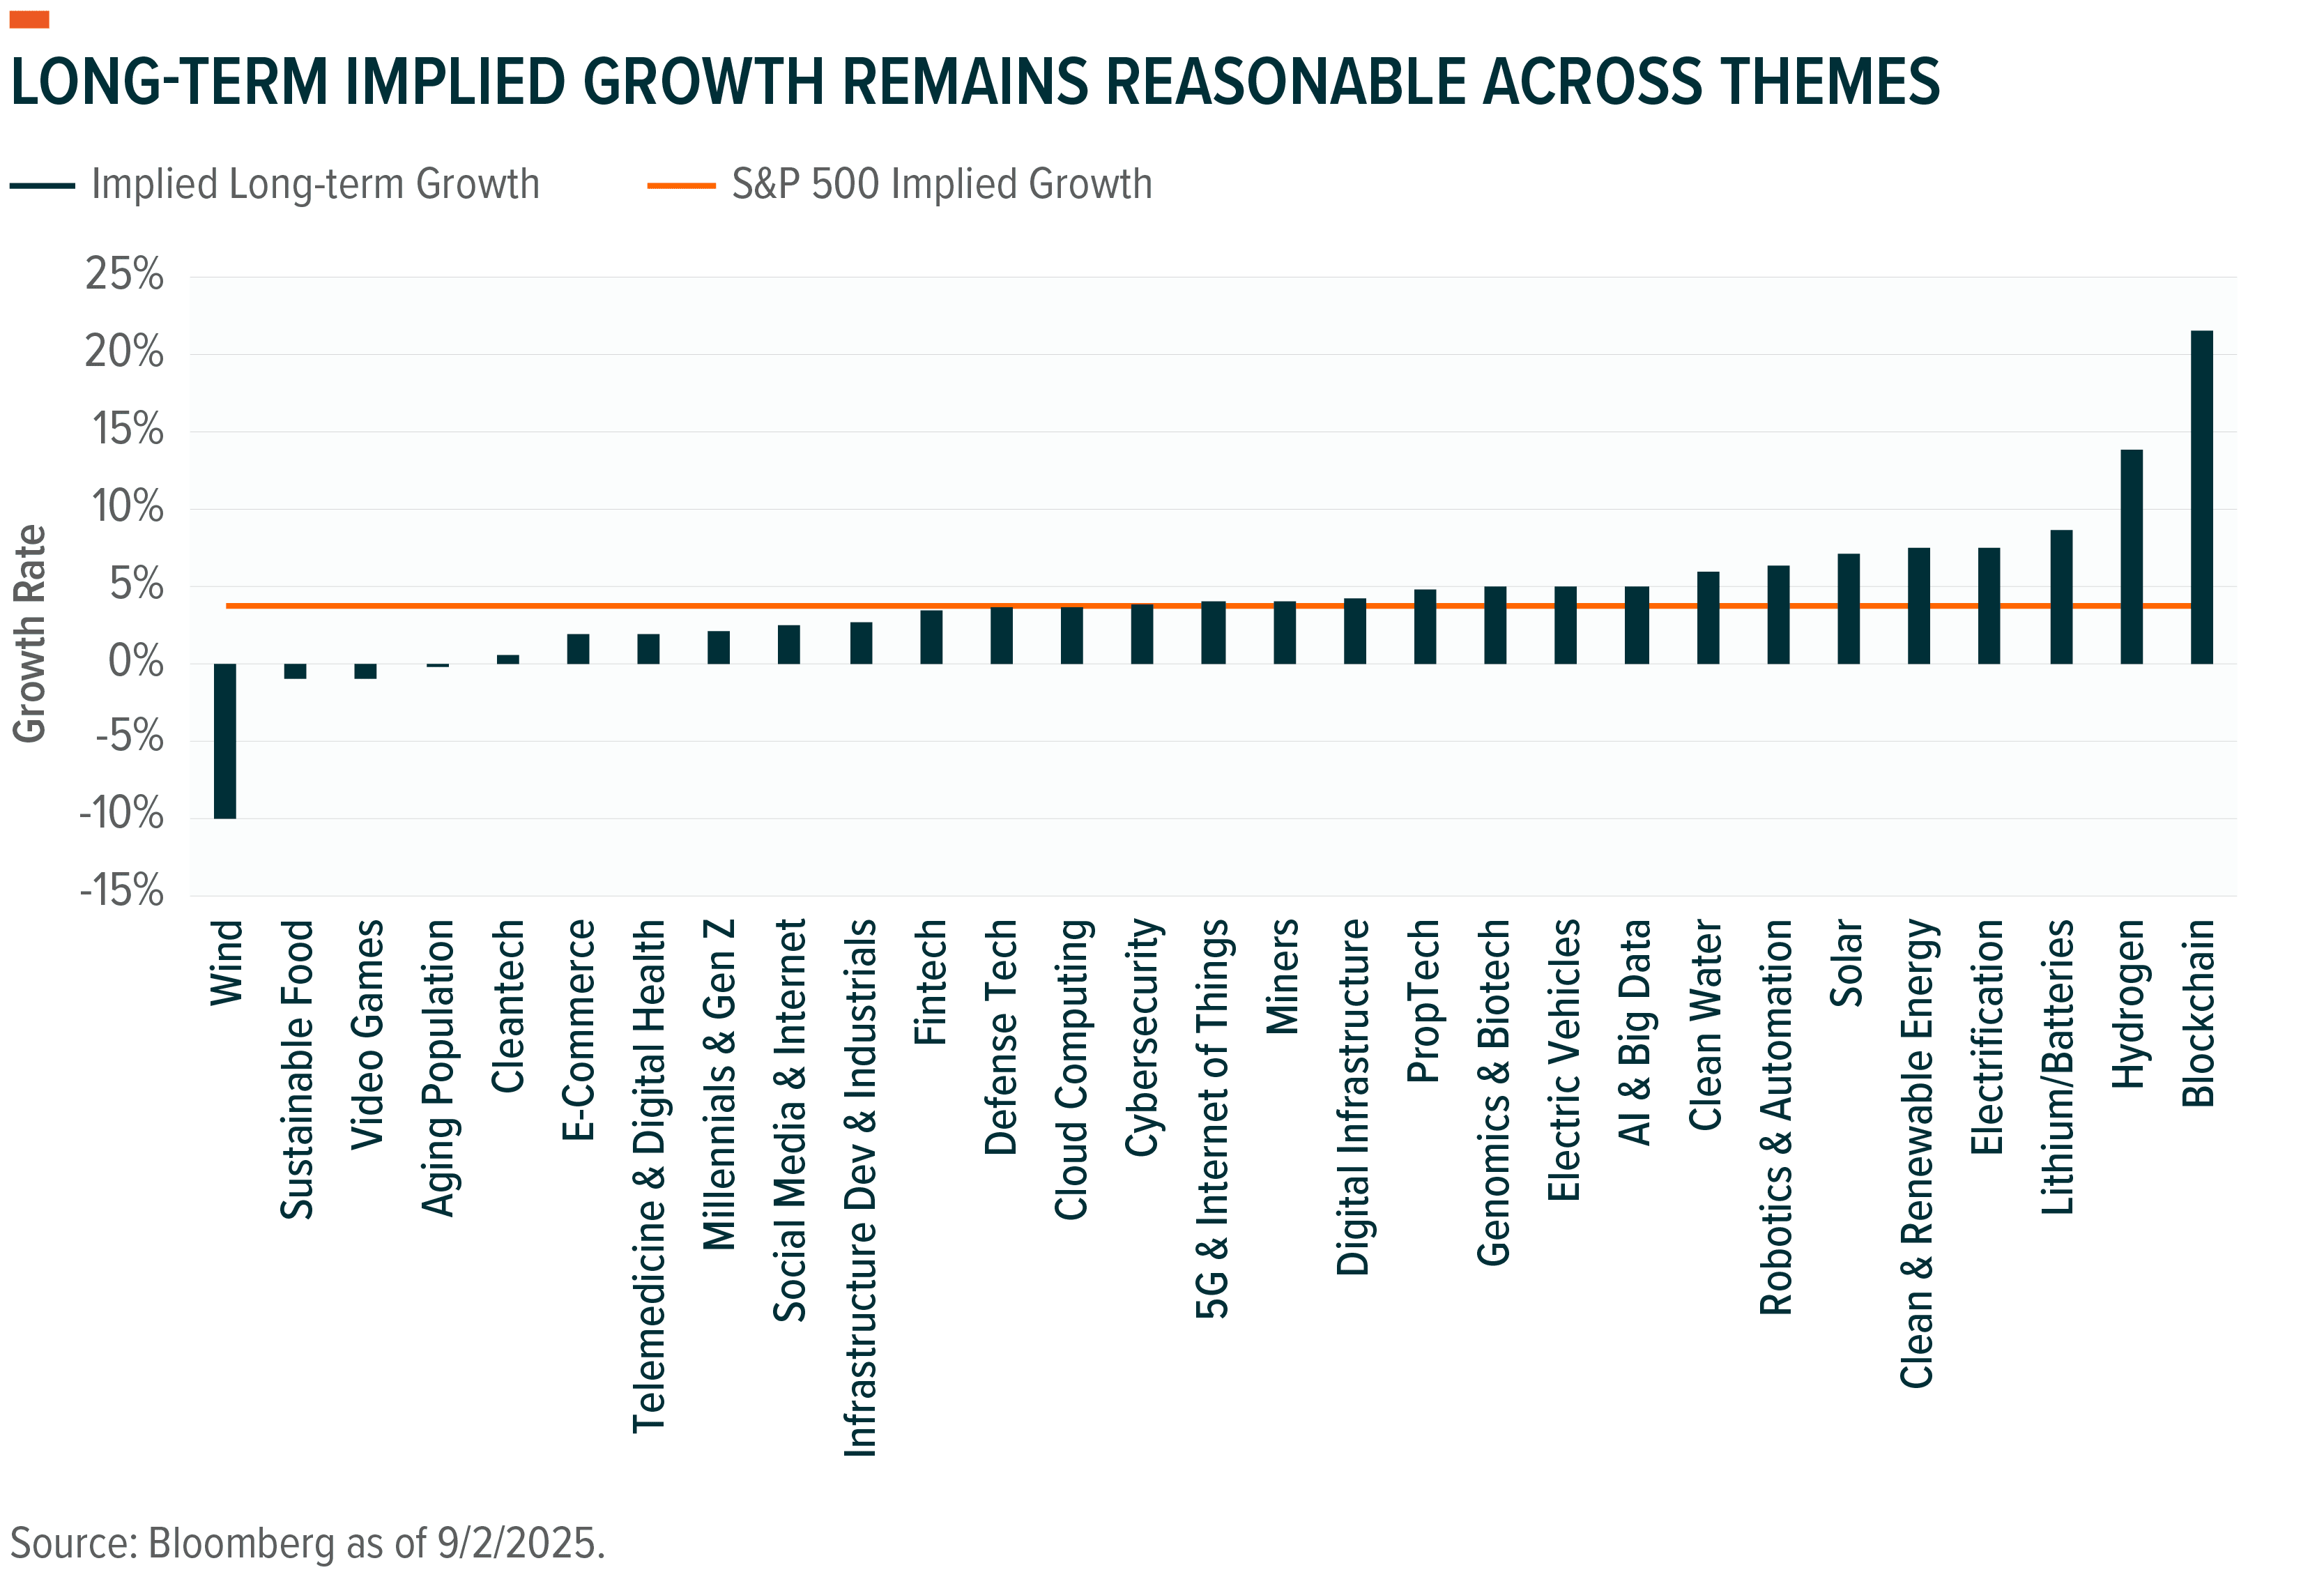
The implied long-term growth rate for the S&P 500 is currently 3.7%, which is in line with pre-pandemic nominal GDP growth levels around 4.1% from 2000 to 2019 and meaningfully below the 6.9% average since 2022.10 In other words, the market’s implied long-term growth is perfectly reasonable and possibly even a little low. For comparison, growth in the 1980s and 1990s ran hotter at 6.5%.
Nominal GDP is forecast to be around 4.5% through 2027, and cash flow growth should outpace that growth.11 A sensitivity analysis suggests the market is near fair value at the current cost of capital and could hold these levels even with lower growth should there be a modest reduction in financing costs with the rate-cutting cycle.
Past performance is not indicative of future results.
Still Room for Persistence
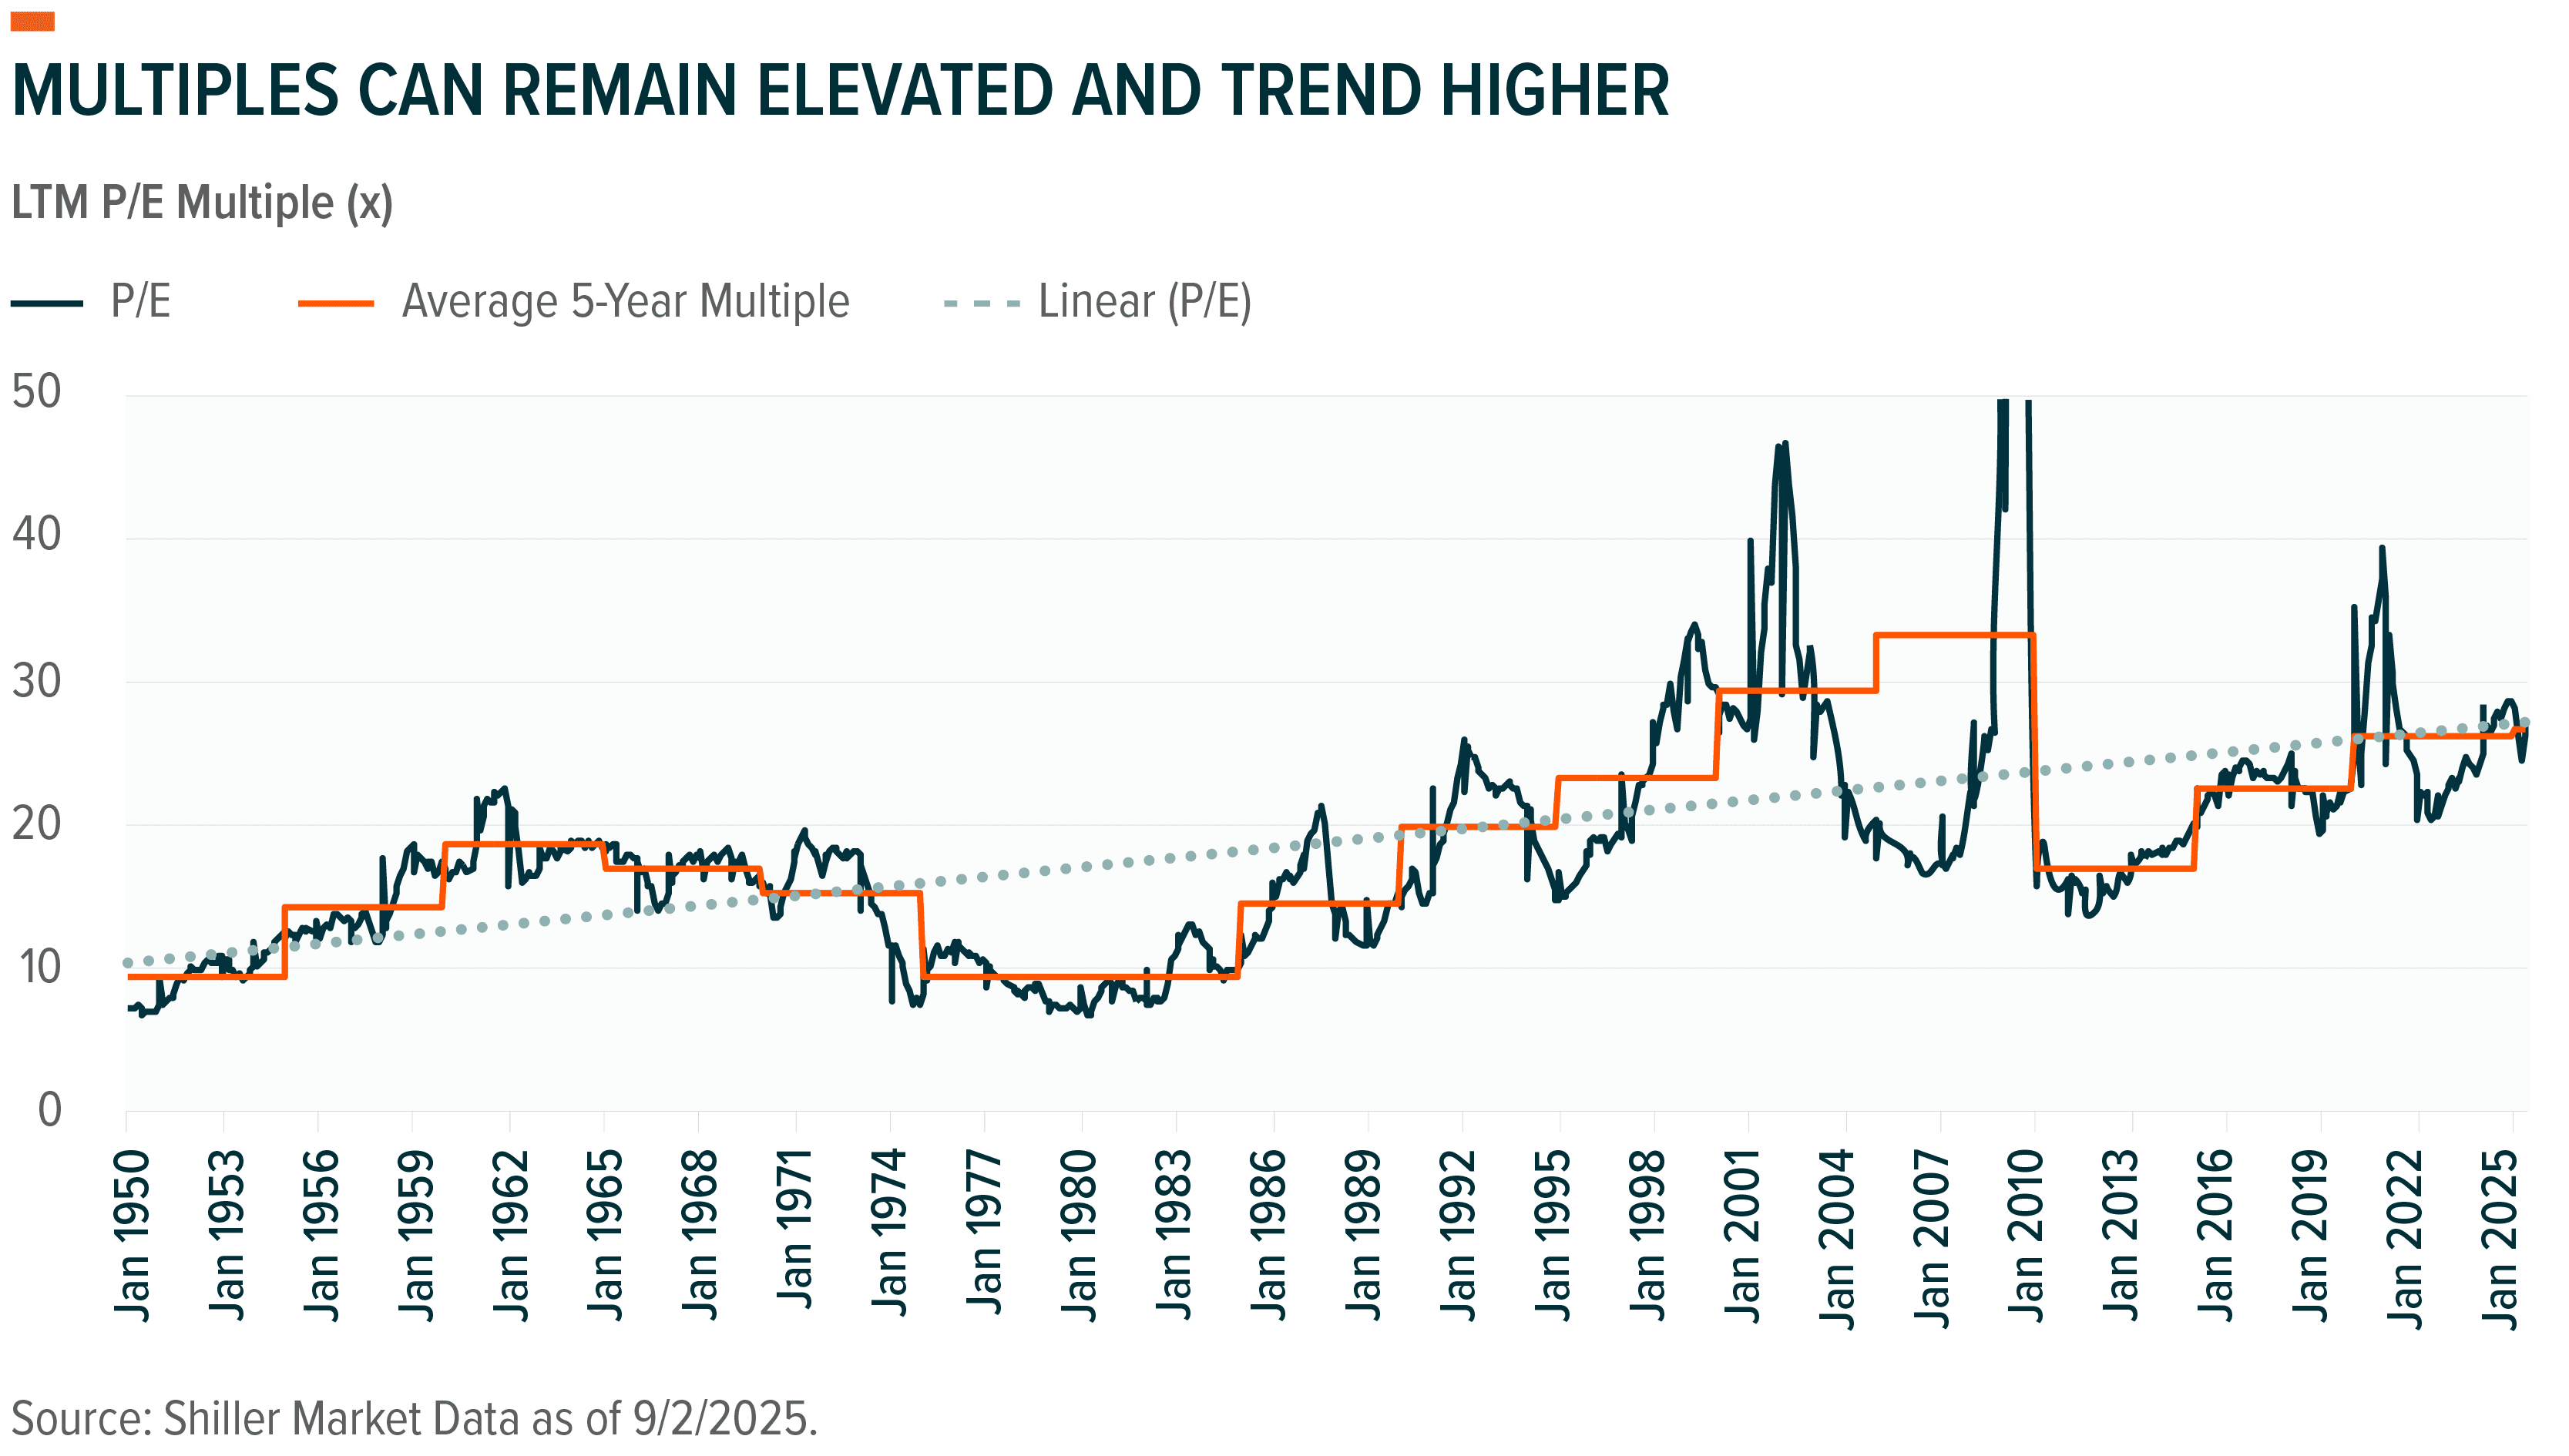
Valuation multiples have trended higher over time. In the first half of the 1950s, for example, the average trailing 12 months PE multiple was 9.4 times.12 In the five years before the pandemic, it averaged 22.6 times. While the path higher has had a few bumps along the way, the current valuation is quite close to the linear trend line going back decades.
Past performance is not indicative of future results
The question for investors is whether market valuations mean revert or prove persistent, which many financial market studies have examined, most by focusing on returns. Proponents of efficient markets generally argue in favor of mean reversion, whereas behavioral economists and complex systems studies note different instances of persistence.13 Market analysis has sliced and diced data in different ways, but it’s hard to argue that markets can’t trend in certain directions for extended periods.
The S&P 500 trailing PE multiple was above the five-year average for 33 months from 1991 to 1994 and 32 months from 1970 to 1973.14 The market has streaks of running above the average for 15 months or more 13 times since 1950. As the saying goes, the market can remain irrational longer than you can remain liquid.
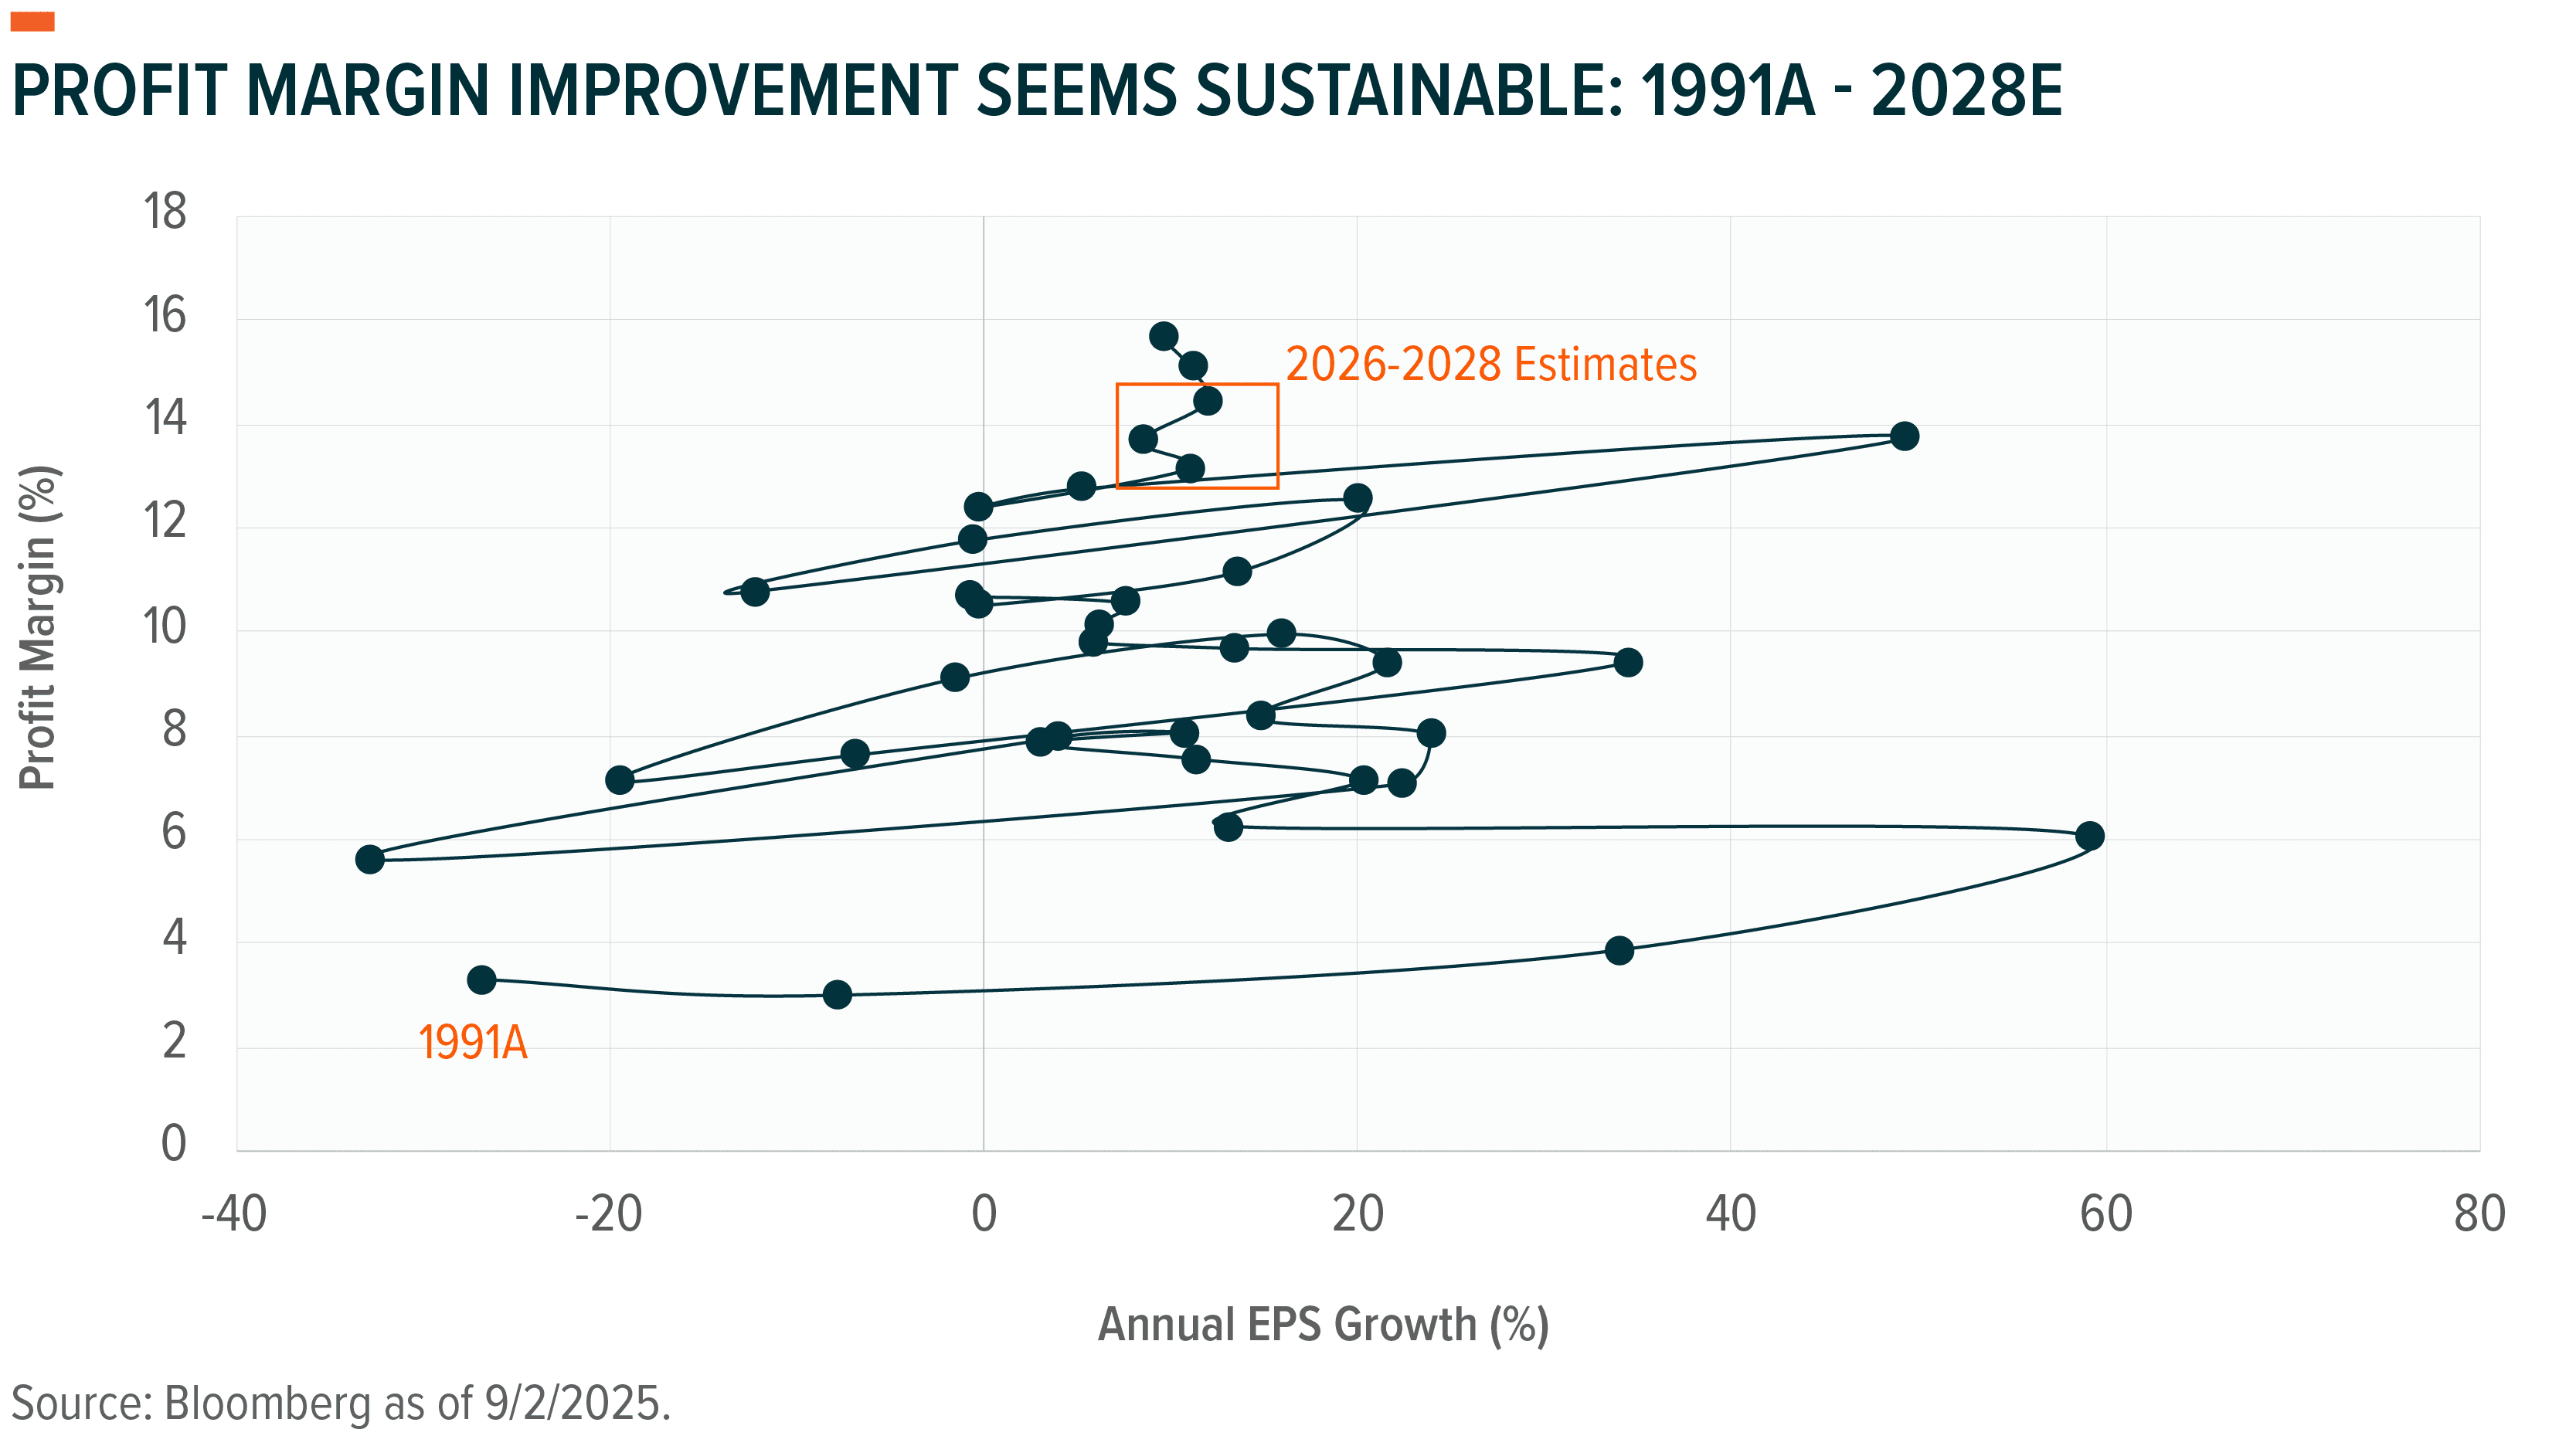
This persistence is partially tied to fundamentals, given the relationship between valuations and profit margins. While profit margins do compress over time, it is usually tied to an exogenous event or shock like the Dot-Com Bust or the Global Financial Crisis. Companies generally have grown more profitable, which is why multiples have moved higher, albeit in nonlinear fashion. Margins are expected to reach 15.7% by 2028, a 2.2% increase from current levels, which would translate to somewhat higher earnings growth and free cash flow.15
Past performance is not indicative of future results.
Michelin Star Themes
With the S&P 500 potentially at fair value, there may be opportunities to capture some upside in specific areas of the market. Much of the cash flow growth and profit margin improvement forecast over the next few years could be tied to secular changes in the economy, particularly those tied to automation technologies like AI and robotics. Many of the themes tied to technology and global competition remain well situated for above-trend growth and improved profitability.16
Comparing the implied long-term growth rate of various themes relative to the S&P 500 can help identify pockets of opportunity. For example, industrial-related themes like Infrastructure Development and Defense Technology are selling at implied growth rates below the broad market.17 These themes may benefit from a cyclical improvement in industrials as interest rates start coming down, but there are also important secular trends that make each theme attractive. Continued onshoring combined with increased energy requirements tied to AI likely translate to continued growth for the Infrastructure Development theme.
Cybersecurity, which is quickly becoming a utility amid software-as-a-service, is selling at the same implied growth rate as Infrastructure Development and Defense Technology.18 It is a compelling theme with state and criminal hacking on the rise and governments and businesses spending to protect their systems. Also, the re-escalation of rivalries with Russia and China likely translates to continued defense spending in the United States and Europe.
Past performance is not indicative of future results.
Many of the themes tied to AI ecosystem are selling at modest growth premiums to the broad market, but the implied rates seem reasonable given the expected growth. For example, data centers are expected to deliver profit margins of 20% by 2028, well above the 16% forecast for S&P 500.19 AI companies are positioned to outgrow cash flows of the broad market by about 10% over the next three years as the technology is integrated across sectors to drive efficiencies.20 Materials companies, such as copper and uranium miners, are also selling at modest premiums but stand to benefit from the technology buildout tied to AI and data centers, which require construction inputs and new sources of energy.
Bon appétit!
—
Originally Posted on September 18, 2025 – Inflection Points: No Reservations, Just Valuations
Footnotes
- Global X analysis with information derived from: Bloomberg L.P. (n.d.) [Data set]. Retrieved on September 2, 2025.
- Helfstein. S (2023, June 1). Inflection Points: The Coiled Equity Spring. Global X. https://www.globalxetfs.com/articles/inflection-points-the-coiled-equity-spring.
- Helfstein, S. (2024, January 31). Inflection Points: The Best Defense Is a Good Offense. Global X. https://www.globalxetfs.com/articles/inflection-points-the-best-defense-is-a-good-offense.
- Global X analysis with information derived from: Bloomberg L.P. (n.d.) [Data set]. Retrieved on September 2, 2025.
- McKinsey & Company Inc., Copeland, T., Koller, T. and Murrin, J. (2000, October 2). Valuation: Measuring and Managing the Value of Companies. Wiley.
- Global X analysis with information derived from: Bloomberg L.P. (n.d.) [Data set]. Retrieved on September 2, 2025.
- Ibid.
- McKinsey & Company Inc., Copeland, T., Koller, T. and Murrin, J. (2000, October 2). Valuation: Measuring and Managing the Value of Companies. Wiley.
- Global X analysis with information derived from: Bloomberg L.P. (n.d.) [Data set]. Retrieved on September 2, 2025.
- Ibid.
- Ibid.
- Ibid.
- Peters, E.E. (1996, August 30). Chaos and Order in the Capital Markets: A New View of Cycles, Prices, and Market Volatility. Wiley.
- Global X analysis with information derived from: Bloomberg L.P. (n.d.) [Data set]. Retrieved on September 2, 2025.
- Ibid.
- Ibid.
- Ibid.
- Ibid.
- Ibid.
- Ibid.
- Thematic category indexes available upon request.
Disclosure: Global X ETFs
Carefully consider the Fund’s investment objectives, risk factors, charges and expenses before investing. This and additional information can be found in the Fund’s full or summary prospectus, which may be obtained by calling 1-888-GX-FUND-1 (1.888.493.8631), or by visiting globalxfunds.com. Read the prospectus carefully before investing.
Disclosure: Interactive Brokers Third Party
Information posted on IBKR Campus that is provided by third-parties does NOT constitute a recommendation that you should contract for the services of that third party. Third-party participants who contribute to IBKR Campus are independent of Interactive Brokers and Interactive Brokers does not make any representations or warranties concerning the services offered, their past or future performance, or the accuracy of the information provided by the third party. Past performance is no guarantee of future results.
This material is from Global X ETFs and is being posted with its permission. The views expressed in this material are solely those of the author and/or Global X ETFs and Interactive Brokers is not endorsing or recommending any investment or trading discussed in the material. This material is not and should not be construed as an offer to buy or sell any security. It should not be construed as research or investment advice or a recommendation to buy, sell or hold any security or commodity. This material does not and is not intended to take into account the particular financial conditions, investment objectives or requirements of individual customers. Before acting on this material, you should consider whether it is suitable for your particular circumstances and, as necessary, seek professional advice.
Disclosure: ETFs
Any discussion or mention of an ETF is not to be construed as recommendation, promotion or solicitation. All investors should review and consider associated investment risks, charges and expenses of the investment company or fund prior to investing. Before acting on this material, you should consider whether it is suitable for your particular circumstances and, as necessary, seek professional advice.
Disclosure: Futures Trading
Futures are not suitable for all investors. The amount you may lose may be greater than your initial investment. Before trading futures, please read the CFTC Risk Disclosure. A copy and additional information are available at the Warnings and Disclosures section of your local Interactive Brokers website.


Join The Conversation
If you have a general question, it may already be covered in our FAQs page. go to: IBKR Ireland FAQs or IBKR U.K. FAQs. If you have an account-specific question or concern, please reach out to Client Services: IBKR Ireland or IBKR U.K..
Visit IBKR U.K. Open an IBKR U.K. Account