


1/ Copper vs. Gold
2/ Insurers Experience Rotation
3/ Gold vs. US Stocks
Investopedia is partnering with CMT Association on this newsletter. The contents of this newsletter are for informational and educational purposes only, however, and do not constitute investing advice. The guest authors, which may sell research to investors, and may trade or hold positions in securities mentioned herein do not represent the views of CMT Association or Investopedia. Please consult a financial advisor for investment recommendations and services.
1/
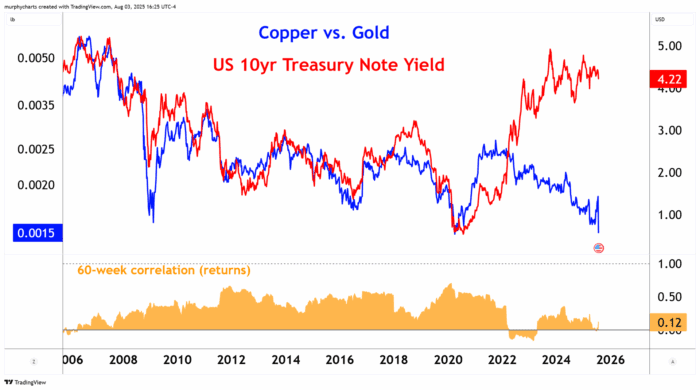
Copper vs. Gold
The Copper/Gold ratio and U.S. 10-year Treasury yield have historically moved in tandem. But since COVID, that relationship has weakened—yields surged on inflation and Fed tightening, while copper lagged on shaky global demand.
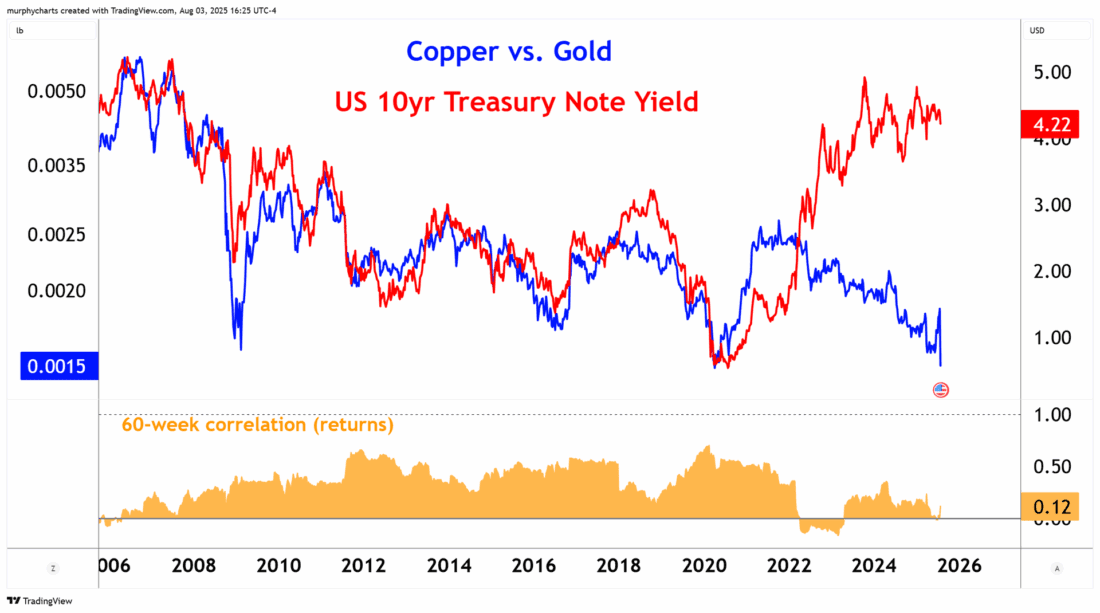
Past performance is not indicative of future results.
Last week saw both copper and yields drop sharply, marking a moment of renewed alignment. It’s unclear if this synchronized decline is suggestive of a dialing back of growth expectations. However, it’s clear the ratio’s reliability hinges heavily on shifting macro drivers like fiscal deficits, central bank purchases of gold, industrial sentiment, and inflation dynamics.
2/
Insurers Experience Rotation
The S&P Insurance Select Industry Index was a standout performer in early 2025, benefiting from its equal-weight structure, strong earnings, and rising premium pricing. Through the end of Q1, the industry was up over 7% year-to-date, strongly outperforming both the broad Financials sector and the S&P 500.
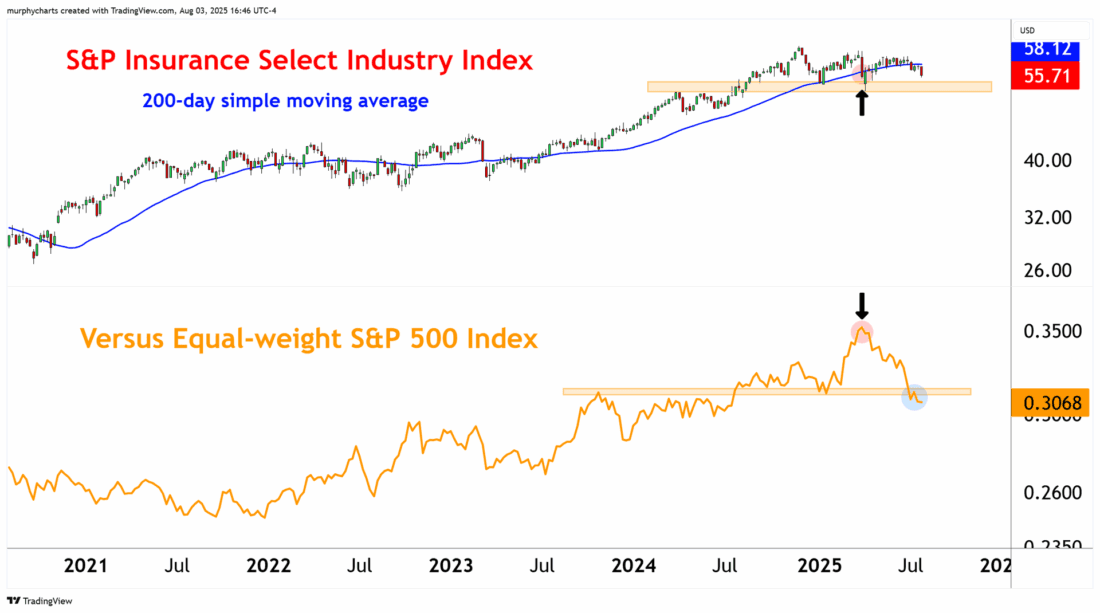
Past performance is not indicative of future results.
But since April, sentiment has shifted. The industry has given back all its Q1 surge, with returns now negative on the year. Insurers are a cyclically defensive trade – In April we witnessed the beginning of a rotation out of defensives and into more sensitive sectors such as Industrials and Technology. Technology is up over 23% from the end of Q1 – certainly evidence of growing risk appetite!
3/
Gold vs. US Stocks
The ratio of Gold prices versus US Stocks as represented by the S&P 500 Index (SPX), is trading into a confluence zone. Evidenced by multi-year resistance and an upward sloping 200-day simple average.
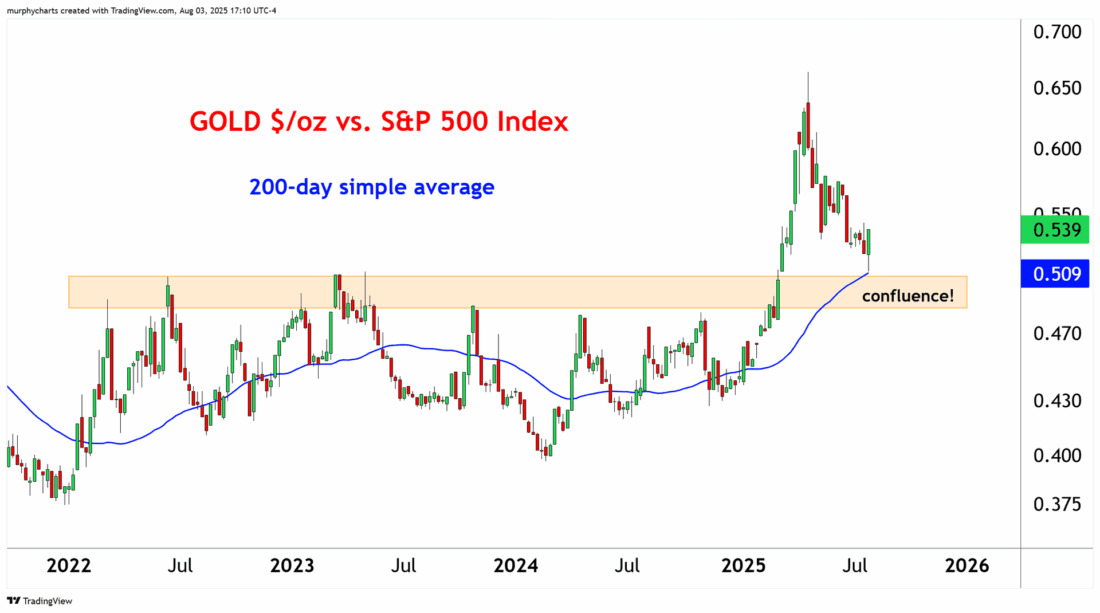
Past performance is not indicative of future results.
The upward slope of the 200-day average highlights the underlying strength in gold relative to stocks, even after a choppy year. Meanwhile, SPX’s resilience near all-time highs makes this test particularly meaningful. Traders are watching this ratio closely—it’s nearing an inflection point that could define the narrative into year-end.
—
Originally posted 04th August 2025
Disclosure: Investopedia
Investopedia.com: The comments, opinions and analyses expressed herein are for informational purposes only and should not be considered individual investment advice or recommendations to invest in any security or to adopt any investment strategy. While we believe the information provided herein is reliable, we do not warrant its accuracy or completeness. The views and strategies described on our content may not be suitable for all investors. Because market and economic conditions are subject to rapid change, all comments, opinions and analyses contained within our content are rendered as of the date of the posting and may change without notice. The material is not intended as a complete analysis of every material fact regarding any country, region, market, industry, investment or strategy. This information is intended for US residents only.
Disclosure: Interactive Brokers Third Party
Information posted on IBKR Campus that is provided by third-parties does NOT constitute a recommendation that you should contract for the services of that third party. Third-party participants who contribute to IBKR Campus are independent of Interactive Brokers and Interactive Brokers does not make any representations or warranties concerning the services offered, their past or future performance, or the accuracy of the information provided by the third party. Past performance is no guarantee of future results.
This material is from Investopedia and is being posted with its permission. The views expressed in this material are solely those of the author and/or Investopedia and Interactive Brokers is not endorsing or recommending any investment or trading discussed in the material. This material is not and should not be construed as an offer to buy or sell any security. It should not be construed as research or investment advice or a recommendation to buy, sell or hold any security or commodity. This material does not and is not intended to take into account the particular financial conditions, investment objectives or requirements of individual customers. Before acting on this material, you should consider whether it is suitable for your particular circumstances and, as necessary, seek professional advice.
Disclosure: Precious Metals
Precious metals may not be available in all locations, please check your local IBKR website for availability.
Disclosure: Bonds
As with all investments, your capital is at risk.


Join The Conversation
If you have a general question, it may already be covered in our FAQs page. go to: IBKR Ireland FAQs or IBKR U.K. FAQs. If you have an account-specific question or concern, please reach out to Client Services: IBKR Ireland or IBKR U.K..
Visit IBKR U.K. Open an IBKR U.K. Account