


 Client Portal – Trading and Advanced Functions (Cantonese)")
 Utilizing Simple Options Trading Strategies (Dutch)")


Originally Posted, 20 November 2024 – Looking back at equity factors in Q3 2024 with WisdomTree
Key Takeaways
- Growth, Momentum and Quality posted the worst return in Q3, which was a complete reversal from the first half of the year.
- Despite continuing the rally, markets observed a sharp rotation across factors and sectors in Q3.
- The S&P 500 equal weighted outperformed in Q3 in the wake of lackluster performance from the Magnificent Seven, pointing to a potential need for investors to diversify their approach to equities going forward.
Markets continued to rally in Q3 across global and emerging market equities, with global equities gaining 6.4%, US equities rising 5.8%, and emerging markets jumping 8.7%. Global developed equities were buoyed by the Federal Reserve’s 50 bps rate cut in September, resilient economic data, and a positive earnings outlook. Emerging markets were strongly impacted by the stimulus package announced by China, which led to a 25% surge in the CSI 300 over a five-session streak in September.
Interestingly, though, this was a continuation of the year-to-date rally in a different form. Utilities, Real Estate, and Financials were the top-performing sectors in Q3, while Information Technology and Communication Services were at the top of the leaderboard in the year’s first half. This rotation hints at a healthier, more sustainable market advance.
This instalment of the WisdomTree Quarterly Equity Factor Review aims to shed some light on how equity factors behaved during this second quarter and how this may have impacted investors’ portfolios.
Performance in focus: A clear rotation of factors in Q3
In Q3, the MSCI World (+6.4%), the MSCI USA (+5.8%) and the MSCI Emerging markets (8.7%) performed strongly on the back of a resilient economy, positive earning news and supportive monetary policies. Like in Q2, Emerging Markets performed the strongest during the quarter following China’s stimulus package.
Factor performance also highlighted the rotation we mentioned above:
- High Dividend, Minimum Volatility and Small Cap posted the strongest return across developed markets in Q3.
- While Quality, Momentum and Growth suffered negative performance. A complete reversal from the first half of 2024.
- In emerging markets, Minimum Volatility posted the only outperformance.
- In that region, Growth suffered the most, followed by Value and Momentum.
Figure 1: Equity factor outperformance in Q3 2024 across regions
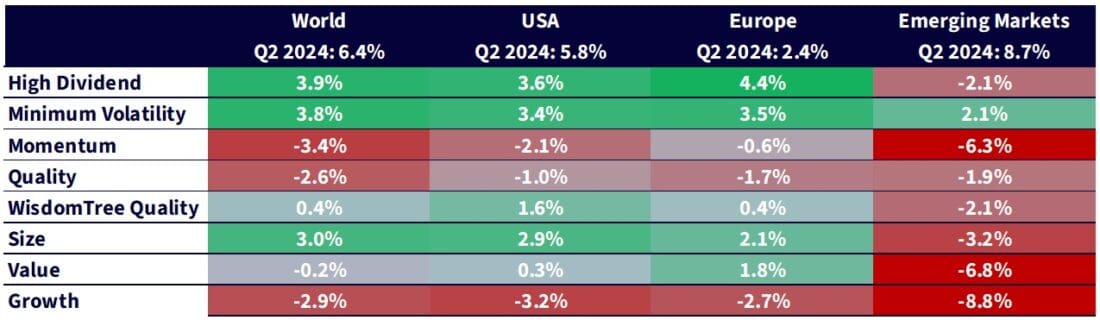
Source: WisdomTree, Bloomberg. 30 June 2024 to 30 September 2024. Calculated in US Dollars for all regions except Europe, where calculations are in EUR. Historical performance is not an indication of future performance and any investments may go down in Value.
YTD factor performance: The picture remains unchanged
Despite the rotation in Q3, the overall picture for 2024 remains unchanged. Momentum remains the best-performing factor in global equities, followed by Quality and Growth. Value and Size remain the weakest ones.
In Emerging Markets, Momentum also posted the strongest performance this year up to the end of September. High Dividend and Minimum Volatility resist but are still posting negative returns.
Figure 2: Equity factor outperformance in 2024
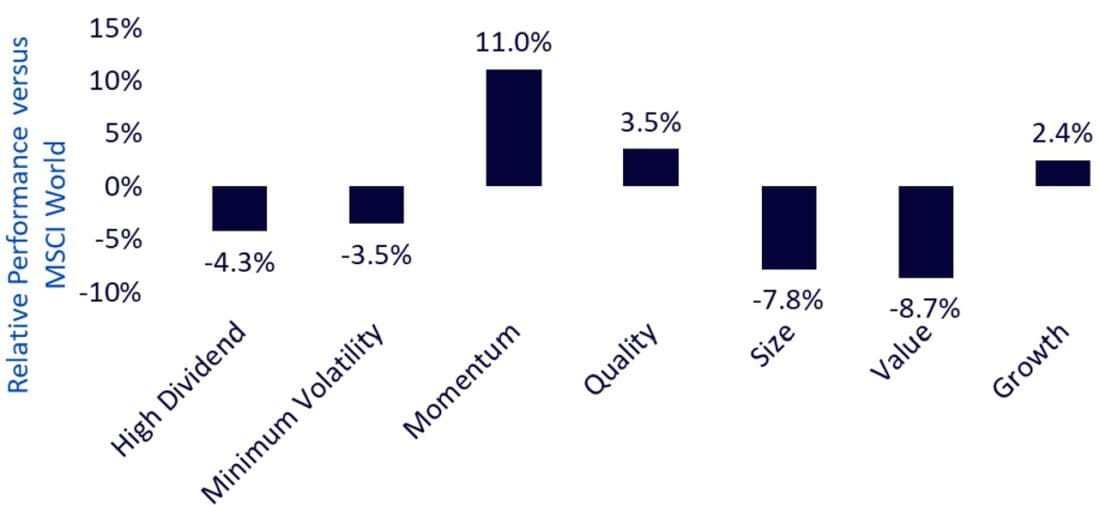
Source: WisdomTree, Bloomberg. 31 December 2023 to 30 September 2024. Calculated in US Dollars. Historical performance is not an indication of future performance and any investments may go down in Value.
Q3: The equity rotation is finally here
It is striking that the worst three performing sectors in Q3 were the best three sectors in the first half of the year. The rotation that we observed in factors is also evident in sectors, and this is a strong sign that the equity rally is gaining in breadth and, therefore, in health as well. It is worth noting that this is not just the case in performance; fundamentals also show such a broadening. Up to mid-2024, earnings growth in the S&P 500 was mostly driven by the Magnificent Seven. However, analyst expectations for the rest of the year and early 2025 indicated that earnings growth would be shared more evenly between the seven biggest stocks and the 493 going forward.
Figure 3: S&P 500 sector performance in 2024

Source: WisdomTree, Bloomberg. 31 December 2023 to 30 September 2024. Calculated in US Dollars. Historical performance is not an indication of future performance and any investments may go down in Value.
The Magnificent Seven’s (except for Tesla’s) performance in Q3 was lacklustre. Alphabet posted the 468th-best performance in the S&P 500, Amazon the 440th, Microsoft the 439th, and Nvidia the 424th.
This resulted in the outperformance of most strategies that focus on diversification and tend to underweight mega caps. The S&P 500 equal weight index is a prime example of the effect of that diversification. It outperformed the S&P 500 by 9.2% over the last quarter.
Figure 4: Relative Performance of S&P 500 Equal Weighted vs S&P 500

Source: WisdomTree, Bloomberg. 31 December 2021 to 30 June 2024. Calculated in US Dollars for all regions except Europe, where calculations are in EUR. Historical performance is not an indication of future performance and any investments may go down in Value.
Valuations increased across the board in Q3
In Q3 2024, developed markets became more expensive. Most factor portfolios also got more expensive, with Small Caps suffering the most significant jump. Only Momentum stocks saw their valuation drop slightly. Growth stocks valuation, especially in the US, remains significantly elevated at 34.7 Price to Earning ratio. In Emerging markets, value stocks and momentum stocks benefited from slightly cheaper valuations, but the other factors also got more expensive. Overall, value stocks remain very cheap, with an 8.1 P/E ratio in the US and 6.9 in Emerging Markets.
Figure 5: Historical evolution of Price to Earnings ratios of equity factors
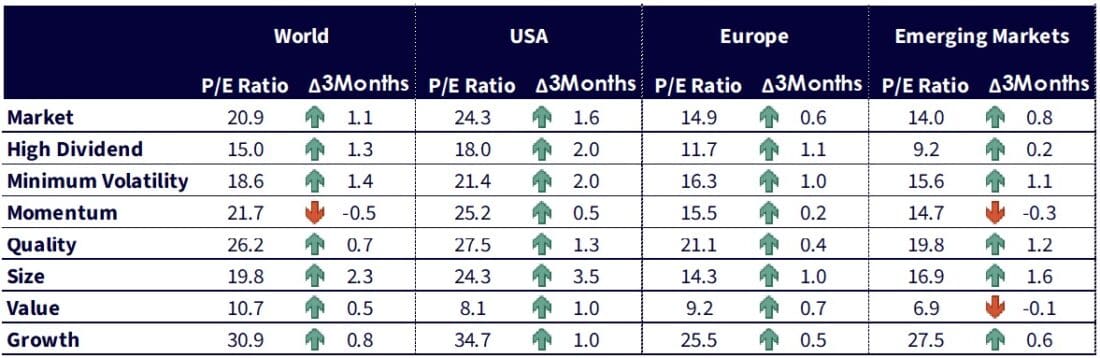
Source: WisdomTree, Bloomberg. As of 30 September 2024. Historical performance is not an indication of future performance and any investments may go down in Value.
Looking forward to the rest of the year
With the Federal Reserve settled in its rate-cut cycle, positive economic data and strong earnings, the equity rally appears poised to continue. However, the broadening of that rally that we observed in Q3 could call for a different approach to the end that worked in the last 18 months. With market concentration at all-time high at the stock level, sector level or country level, strategies that favour diversification could be a good approach for investors. A balanced approach allowing for investment outside of large caps and mega caps could enable investors to benefit from the broadening while diversifying their risk.
World is proxied by MSCI World net TR Index. US is proxied by MSCI USA net TR Index. Europe is proxied by MSCI Europe net TR Index. Emerging Markets is proxied by MSCI Emerging Markets net TR Index. Minimum volatility is proxied by the relevant MSCI Min Volatility net total return index. Quality is proxied by the relevant MSCI Quality net total return index.
Momentum is proxied by the relevant MSCI Momentum net total return index. High Dividend is proxied by the relevant MSCI High Dividend net total return index. Size is proxied by the relevant MSCI Small Cap net total return index. Value is proxied by the relevant MSCI Enhanced Value net total return index. WisdomTree Quality is proxied by the relevant WisdomTree Quality Dividend Growth Index.
Disclosure: WisdomTree Europe
This material is prepared by WisdomTree and its affiliates and is not intended to be relied upon as a forecast, research or investment advice, and is not a recommendation, offer or solicitation to buy or sell any securities or to adopt any investment strategy. The opinions expressed are as of the date of production and may change as subsequent conditions vary. The information and opinions contained in this material are derived from proprietary and non-proprietary sources. As such, no warranty of accuracy or reliability is given and no responsibility arising in any other way for errors and omissions (including responsibility to any person by reason of negligence) is accepted by WisdomTree, nor any affiliate, nor any of their officers, employees or agents. Reliance upon information in this material is at the sole discretion of the reader. Past performance is not a reliable indicator of future performance.
Please click here for our full disclaimer.
Jurisdictions in the European Economic Area (“EEA”): This content has been provided by WisdomTree Ireland Limited, which is authorised and regulated by the Central Bank of Ireland.
Jurisdictions outside of the EEA: This content has been provided by WisdomTree UK Limited, which is authorised and regulated by the United Kingdom Financial Conduct Authority.
Disclosure: Interactive Brokers Third Party
Information posted on IBKR Campus that is provided by third-parties does NOT constitute a recommendation that you should contract for the services of that third party. Third-party participants who contribute to IBKR Campus are independent of Interactive Brokers and Interactive Brokers does not make any representations or warranties concerning the services offered, their past or future performance, or the accuracy of the information provided by the third party. Past performance is no guarantee of future results.
This material is from WisdomTree Europe and is being posted with its permission. The views expressed in this material are solely those of the author and/or WisdomTree Europe and Interactive Brokers is not endorsing or recommending any investment or trading discussed in the material. This material is not and should not be construed as an offer to buy or sell any security. It should not be construed as research or investment advice or a recommendation to buy, sell or hold any security or commodity. This material does not and is not intended to take into account the particular financial conditions, investment objectives or requirements of individual customers. Before acting on this material, you should consider whether it is suitable for your particular circumstances and, as necessary, seek professional advice.
Disclosure: ETFs
Any discussion or mention of an ETF is not to be construed as recommendation, promotion or solicitation. All investors should review and consider associated investment risks, charges and expenses of the investment company or fund prior to investing. Before acting on this material, you should consider whether it is suitable for your particular circumstances and, as necessary, seek professional advice.


Join The Conversation
If you have a general question, it may already be covered in our FAQs page. go to: IBKR Ireland FAQs or IBKR U.K. FAQs. If you have an account-specific question or concern, please reach out to Client Services: IBKR Ireland or IBKR U.K..
Visit IBKR U.K. Open an IBKR U.K. Account